Why Use the Operations Page
- Track All Operations: Monitor every operation executed against your federated graph
- Analyze Deprecated Fields: Identify which operations use deprecated fields and which clients are affected
- Make Safe Schema Changes: Use usage data to safely remove deprecated fields
- Monitor Client Usage: Track how different clients interact with your operations and identify usage patterns
- Debug Performance Issues: Sort operations by latency or error rate to quickly identify problematic operations
- Plan Schema Evolution: Use data-driven insights for migration planning and client communication
Page Layout
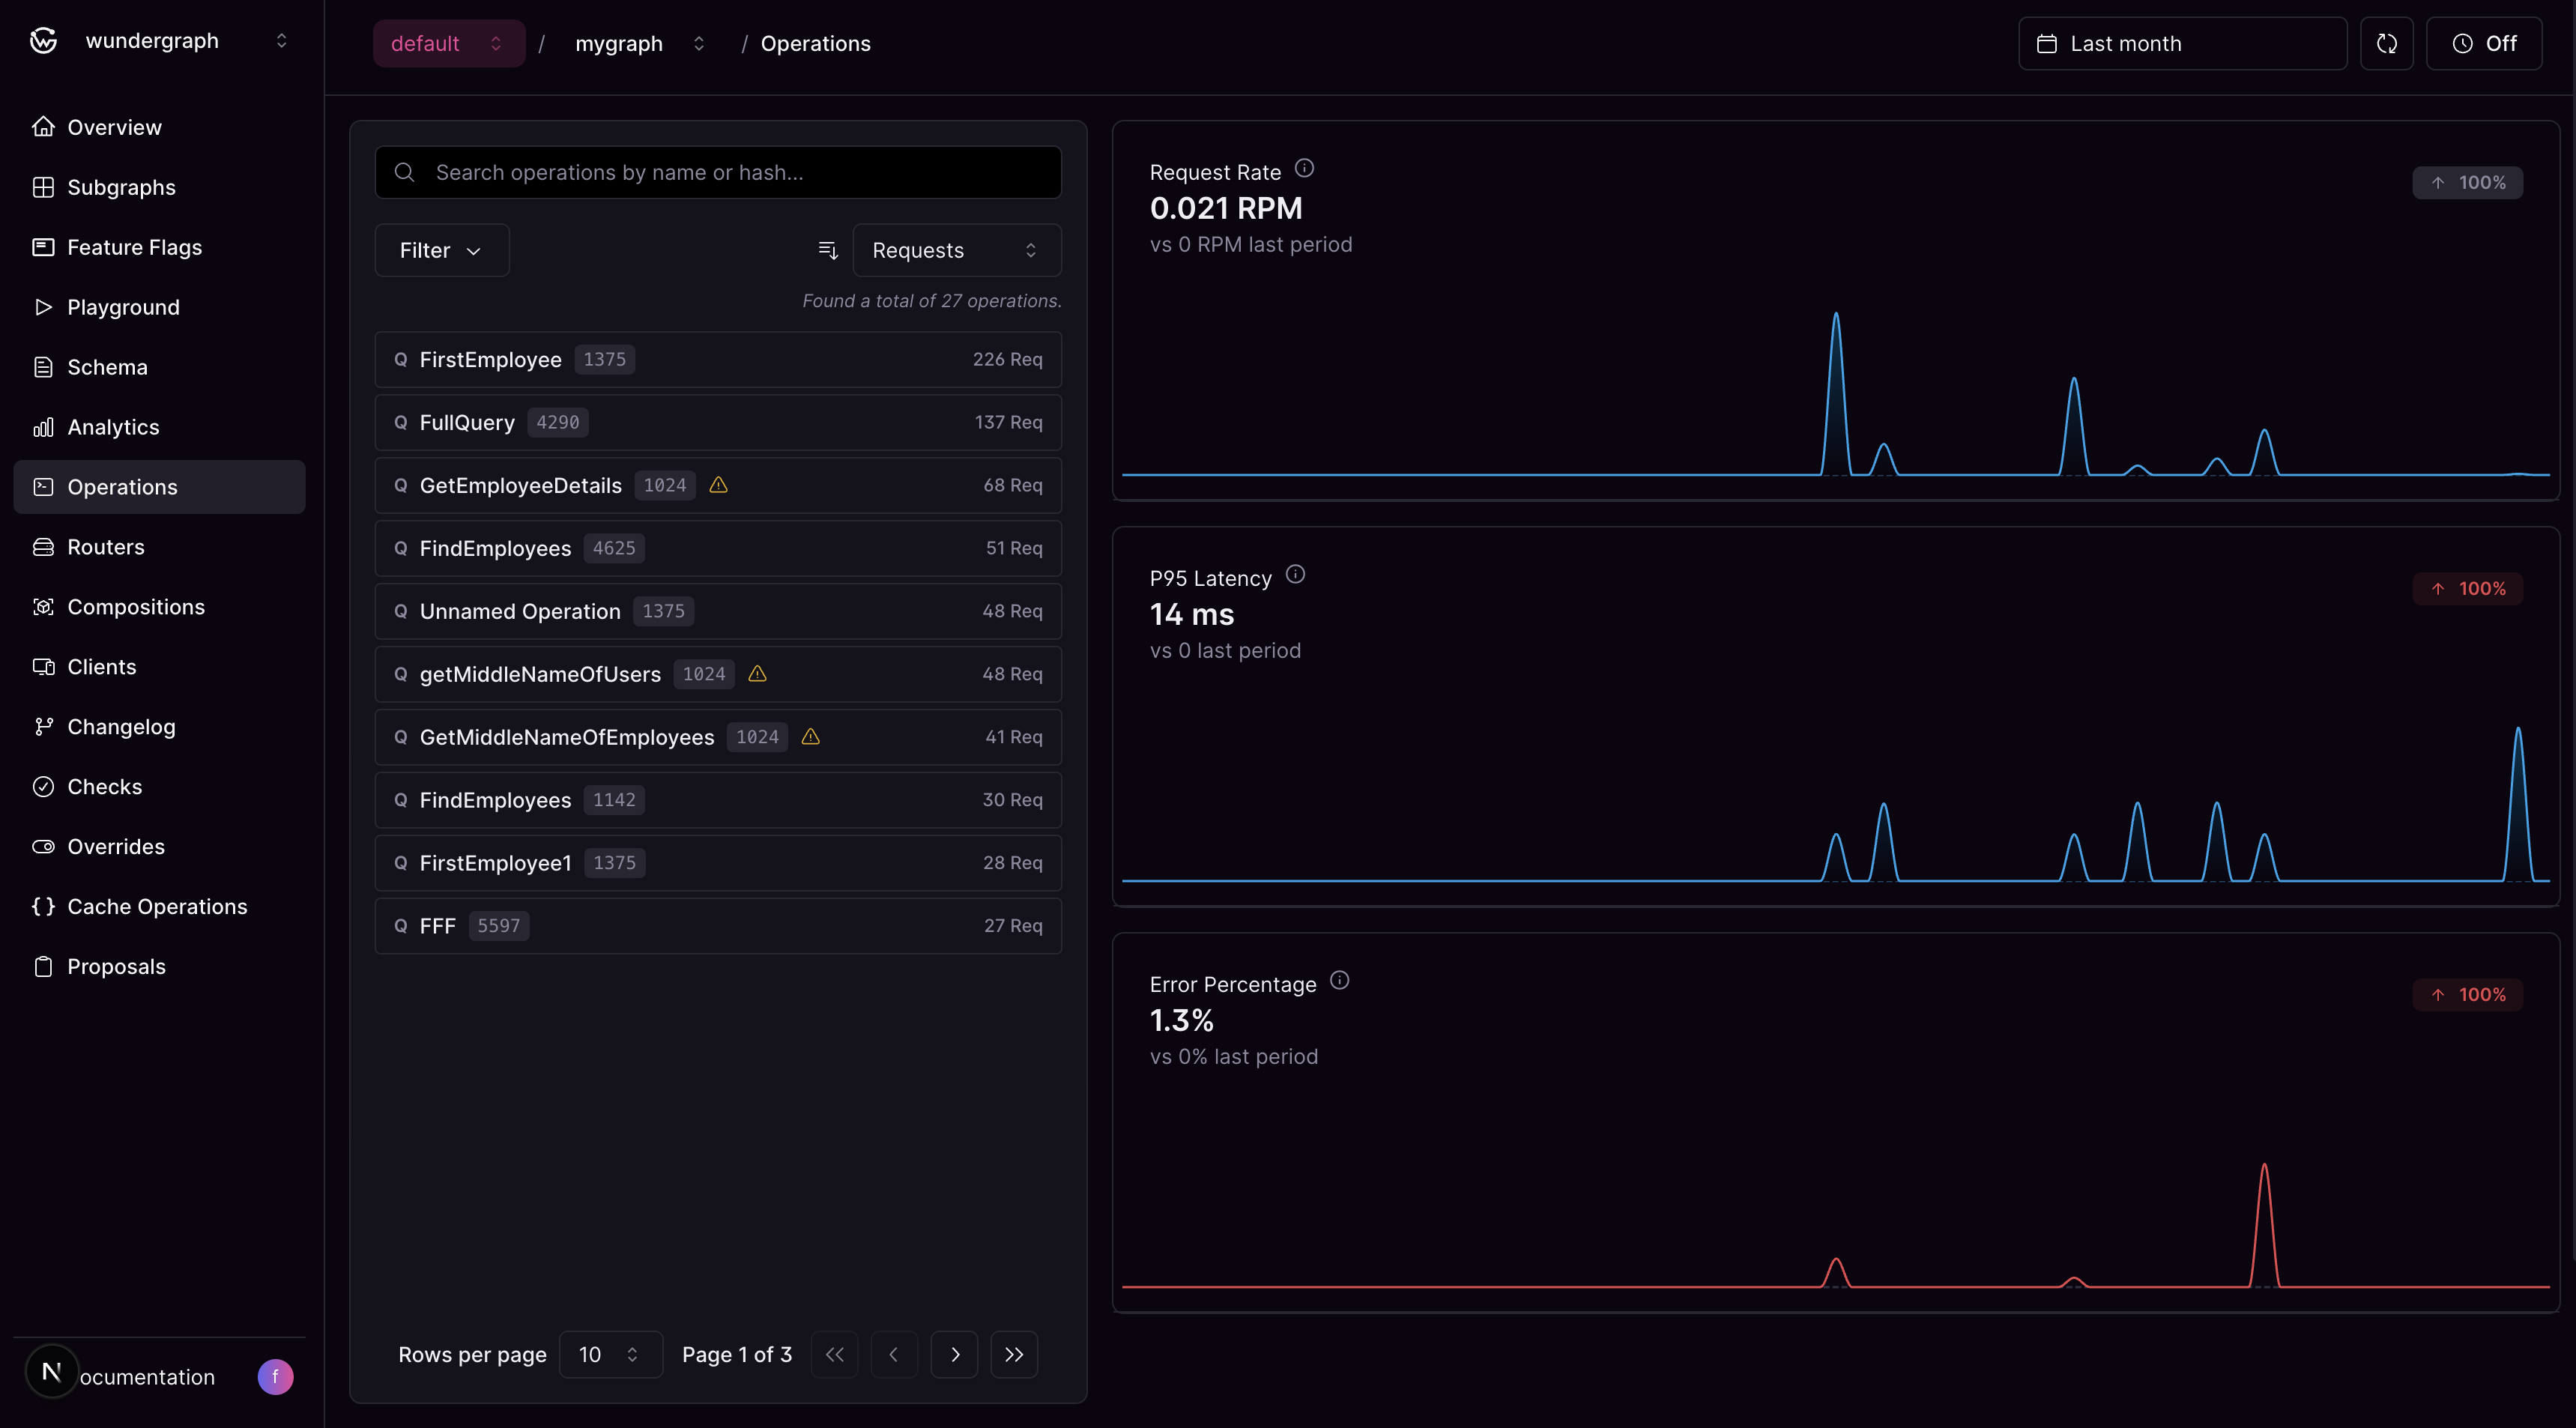
The Operations page features a responsive two-panel layout designed for efficient operation analysis:Operations List
The left panel displays a searchable, filterable list of all operations executed against your federated graph. Search and Filtering Options:- Text Search: Search by operation name or hash
- Sort by Metrics: Choose from Request Count (default), Latency, or Error Rate
- Sort Direction: Toggle between ascending and descending order
- Deprecated Fields Filter: Show only operations with deprecated fields to focus on operations that need attention during schema evolution
- Client Name Filter: Filter operations by specific clients to analyze client-specific usage patterns and behavior
- Flexible Date Ranges: Choose from predefined ranges or set custom dates, respecting your plan’s retention limits
- Operation Name: The name of the GraphQL operation (or “Unnamed Operation” for operations without names)
- Operation Type: Query, Mutation, or Subscription
- Performance Metrics: Based on your selected sorting criteria (latency, request count, or error rate)
- Deprecated Fields Indicator: Visual indicator if the operation uses deprecated schema fields
Operation Details & Analytics
The operation details and analytics panel dynamically displays either:- Overview Analytics: Aggregate metrics for all operations when no specific operation is selected
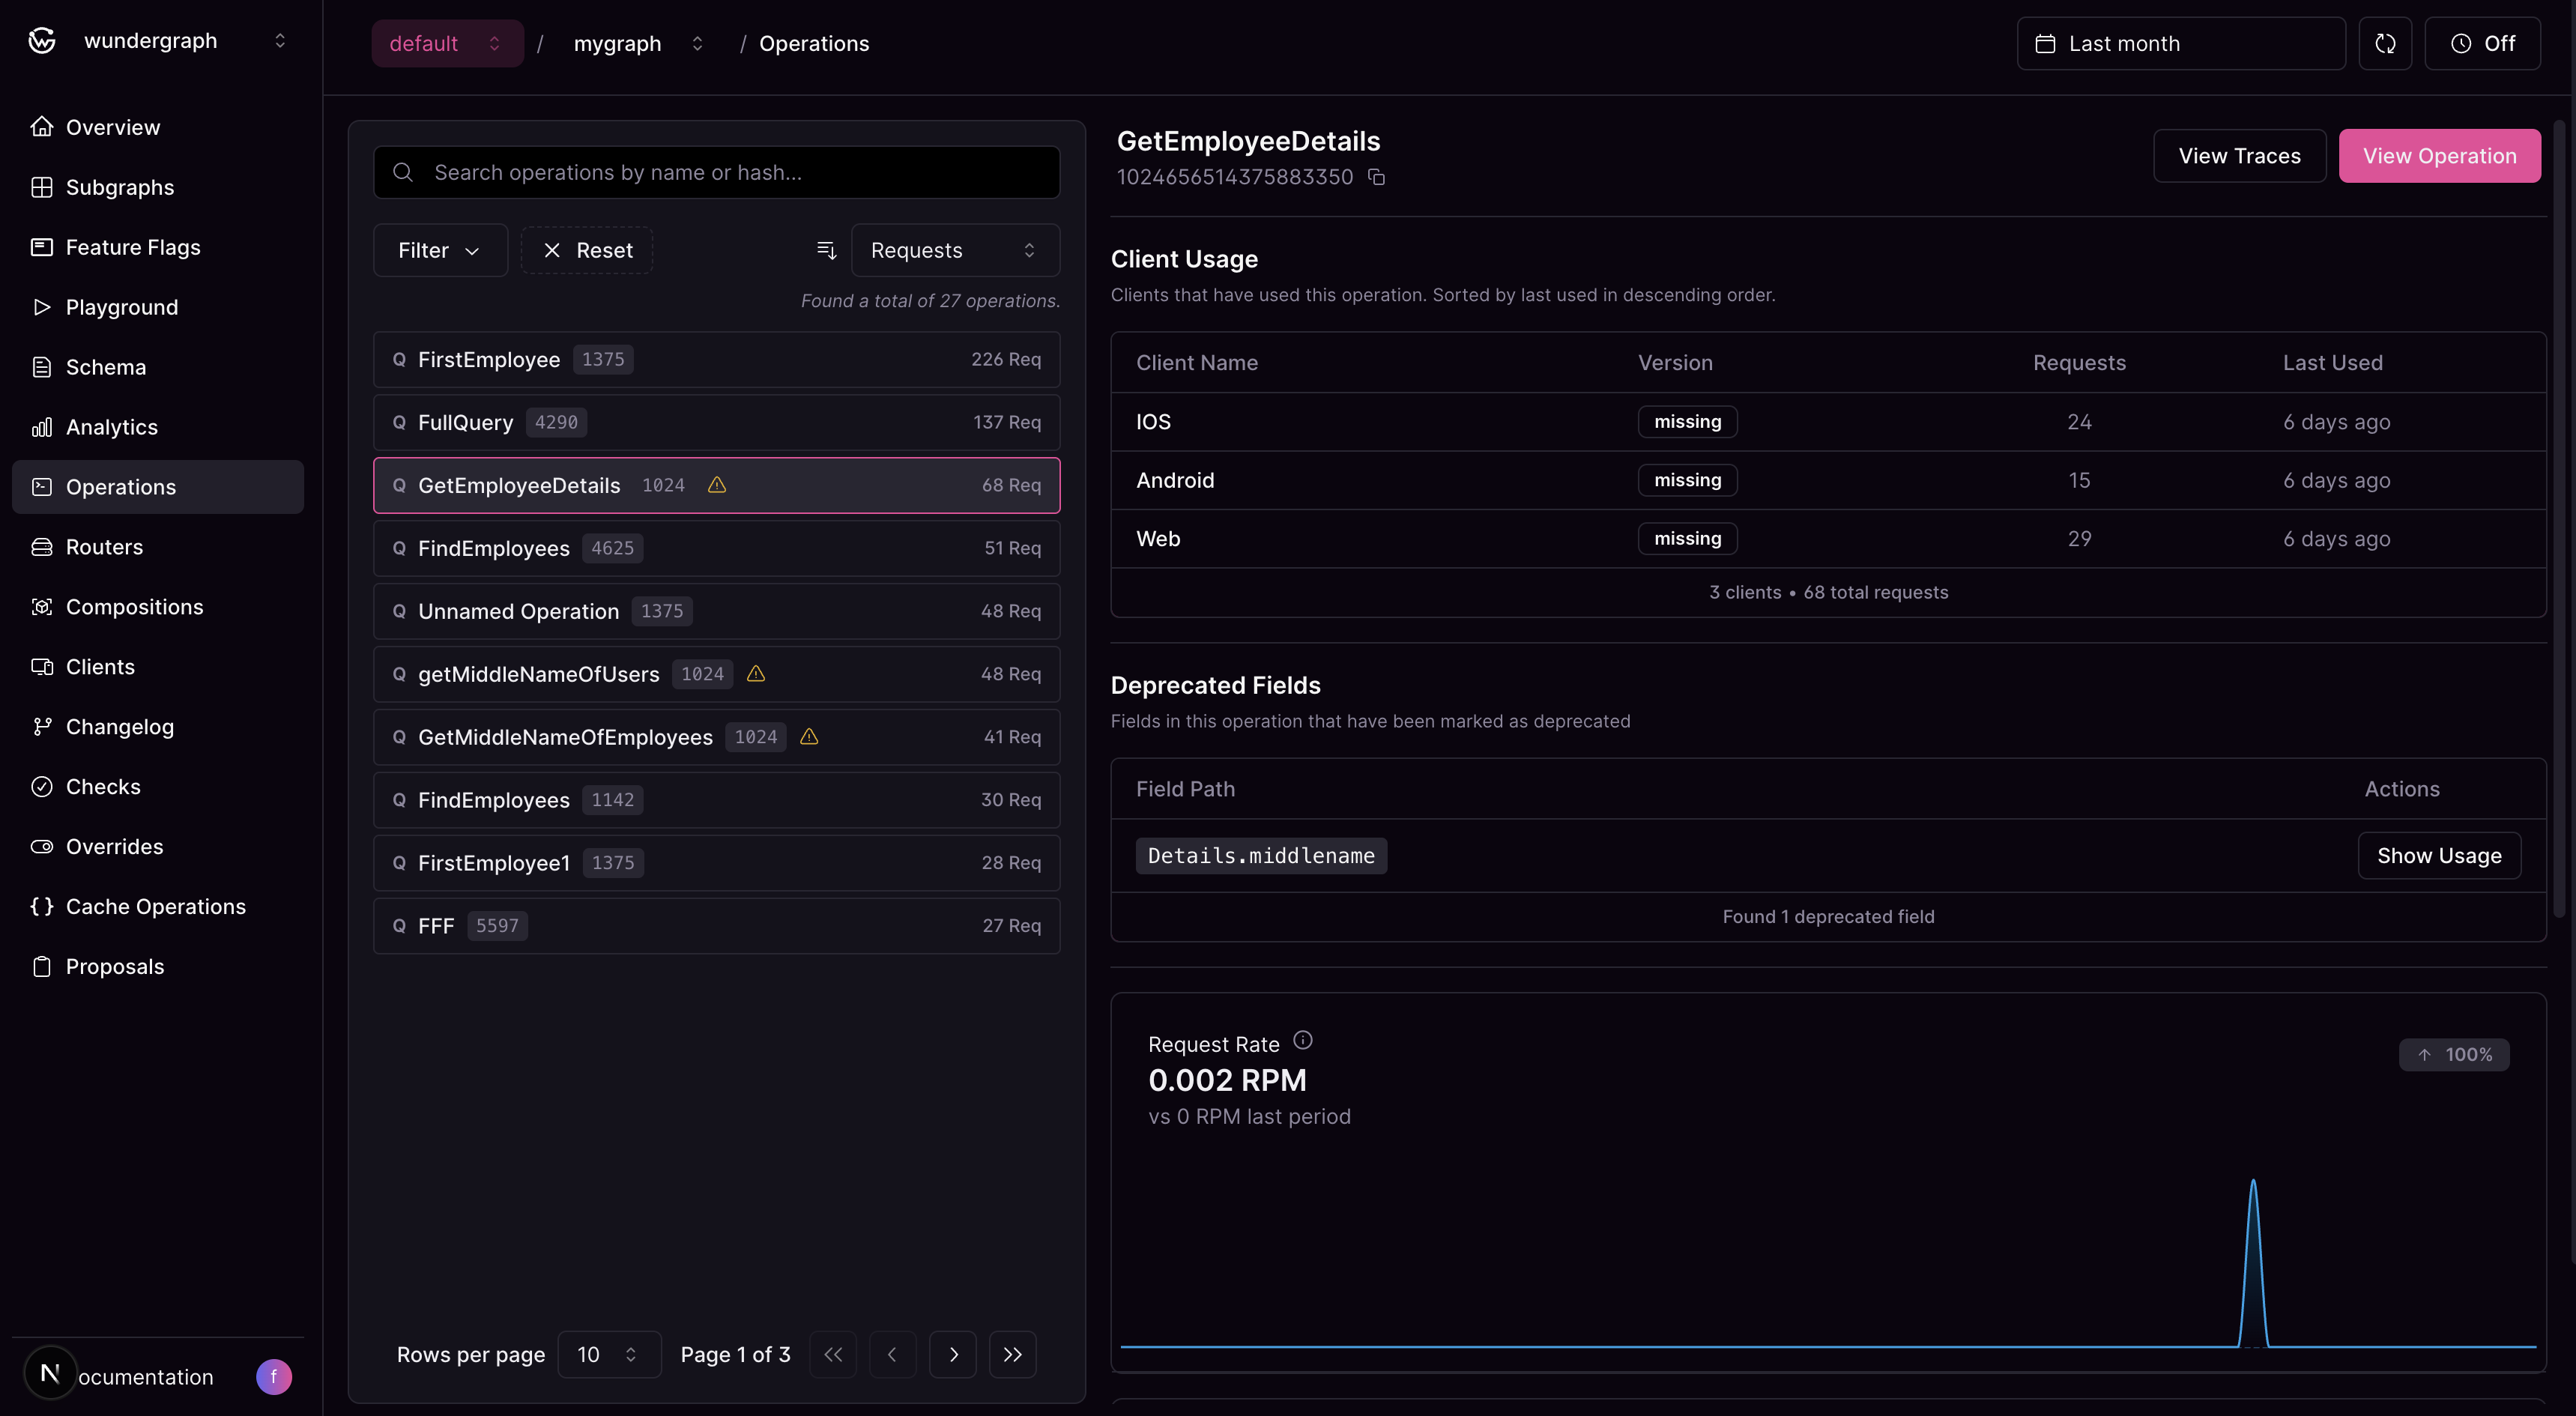
- Operation-Specific Analytics: Detailed metrics and insights for a selected operation
- Client Usage: View the clients that have used the operation and the number of requests made by them
- Deprecated Fields: List of deprecated fields used by the operation
- Performance Metrics: Visual charts displaying request rate, P95 latency, and error percentage trends for the selected operation
Additional Features
When working with operations, you can also:- Navigate to Traces: Jump directly to the Analytics Traces page with pre-applied filters for the selected operation
- Inspect Operation Content: View the complete GraphQL operation with syntax highlighting in a modal
