Cosmo Studio trace view for GraphQL query performance analysis
- Authenticate: (Optional) Is enabled only when the request is made against the configured authentication provider. An error indicates an unauthorized request.
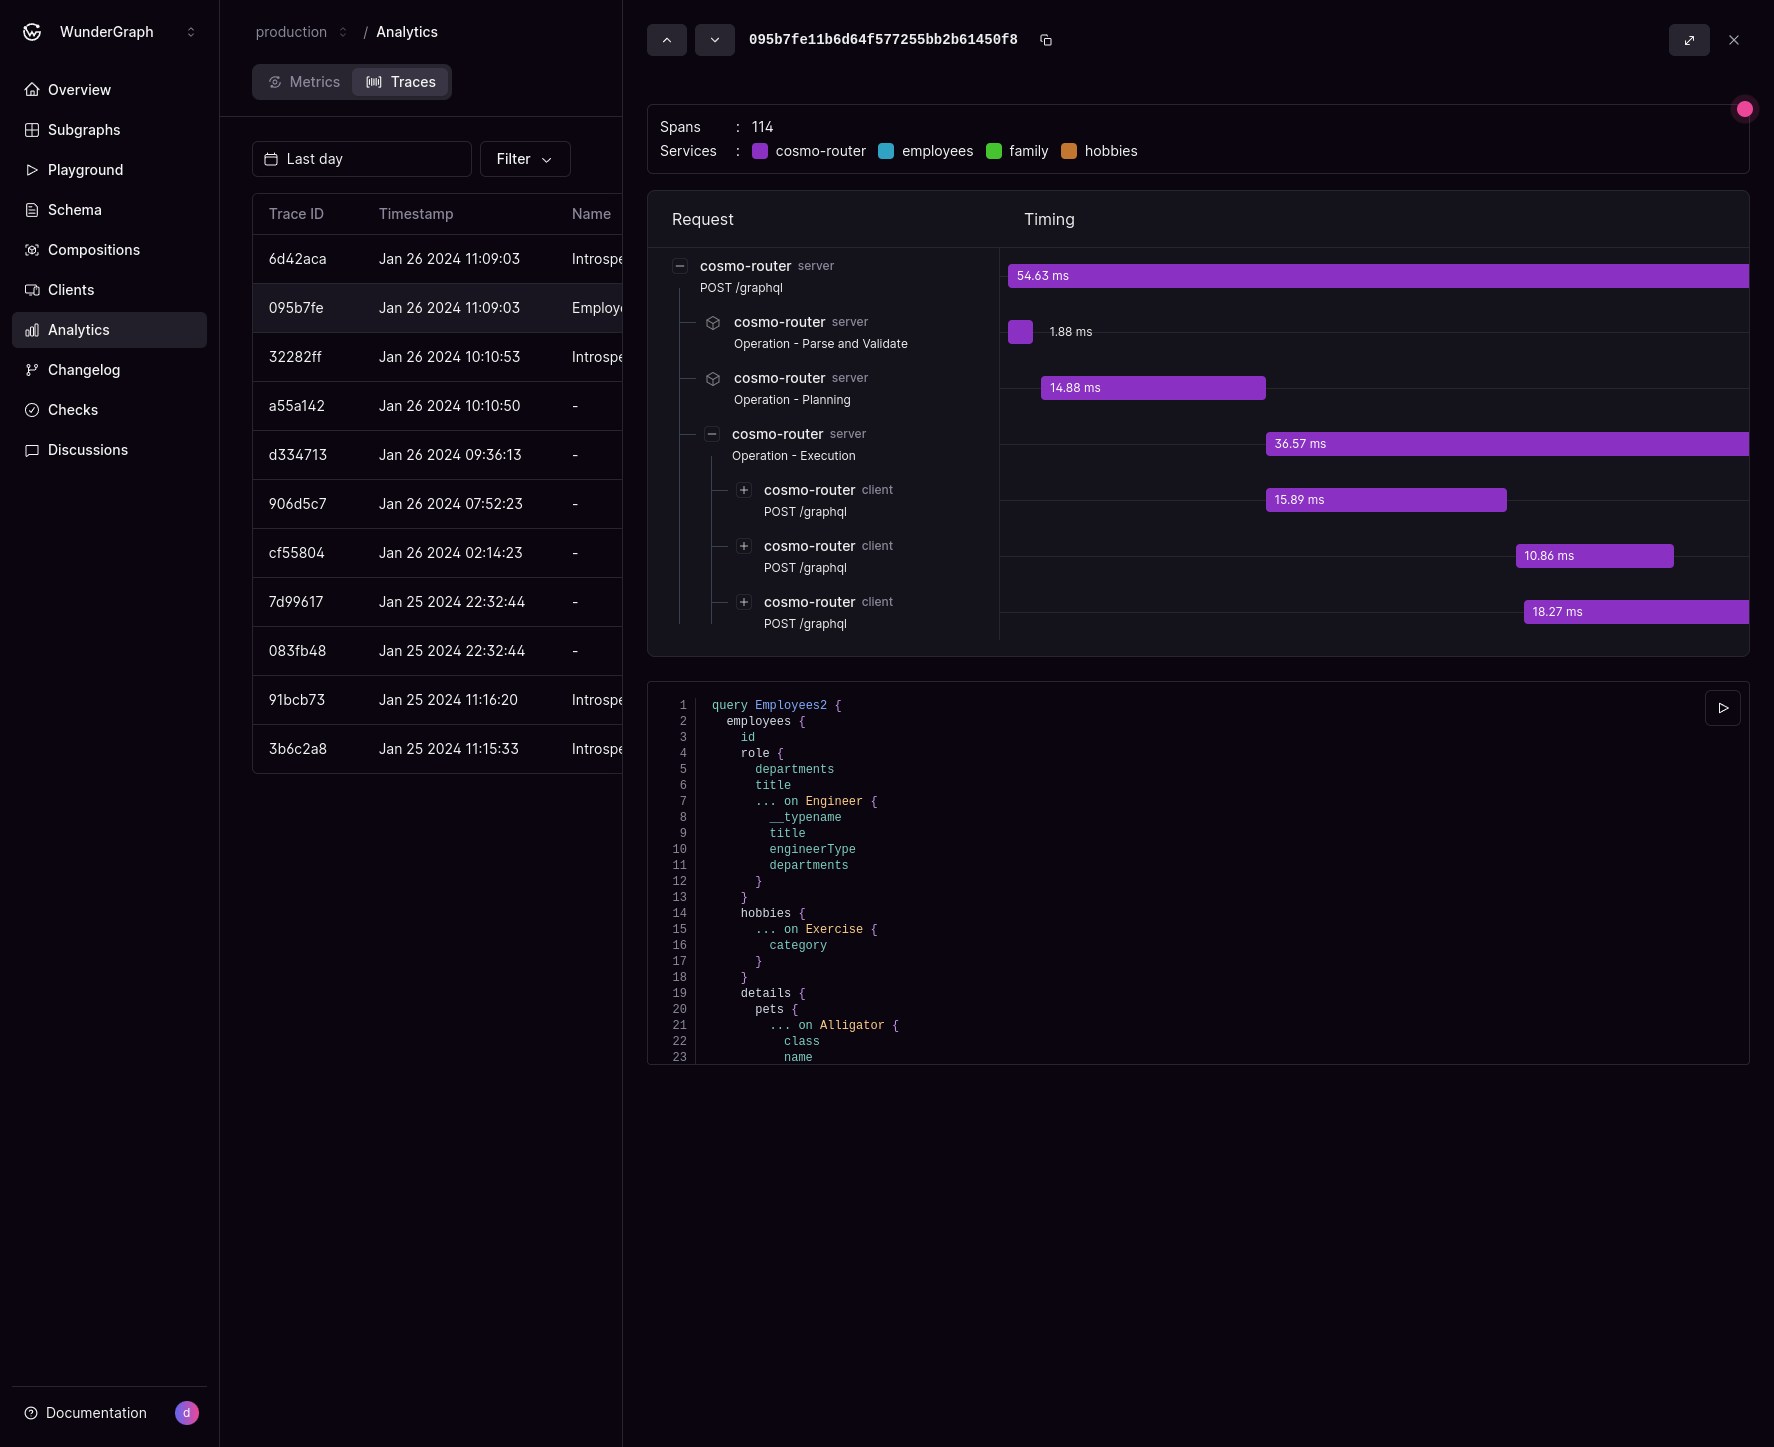
- Operation - Parse and Validate: This is the first step in the query execution. It parses the variables, query and validates it against the schema.
-
Operation - Planning: Describes the process of building the optimized query plan for a given GraphQL query. This includes normalization, validating it against the schema. We provide additional attributes:
- engineRequestTracingEnabled: Indicates if ART has been enabled for the request. ART has a performance penalty and should not be used for all traffic.
- enginePlanCacheHit: Indicates whether the query plan was retrieved from the cache. This should occur after the second execution of the query. Missing this could suggest that either ART was used or the cache is full. Additionally, if you run multiple instances of the router, a cache miss could occur several times until the cache is warmed up on all instances.
- Operation - Execution: Describes the process of executing the query plan for an operation. This includes fetching data from the subgraphs, aggregating the data and returning it to the client.