The total number of subgraphs currently existing in your federated graph. Each subgraph represents a portion of your graph’s schema. The illustration on the right also shows which subgraphs were federated.
The Label Matchers provides information on the labelling system employed within your federated graph. The subgraphs are selected for federation based on these label matchers. Learn more here.
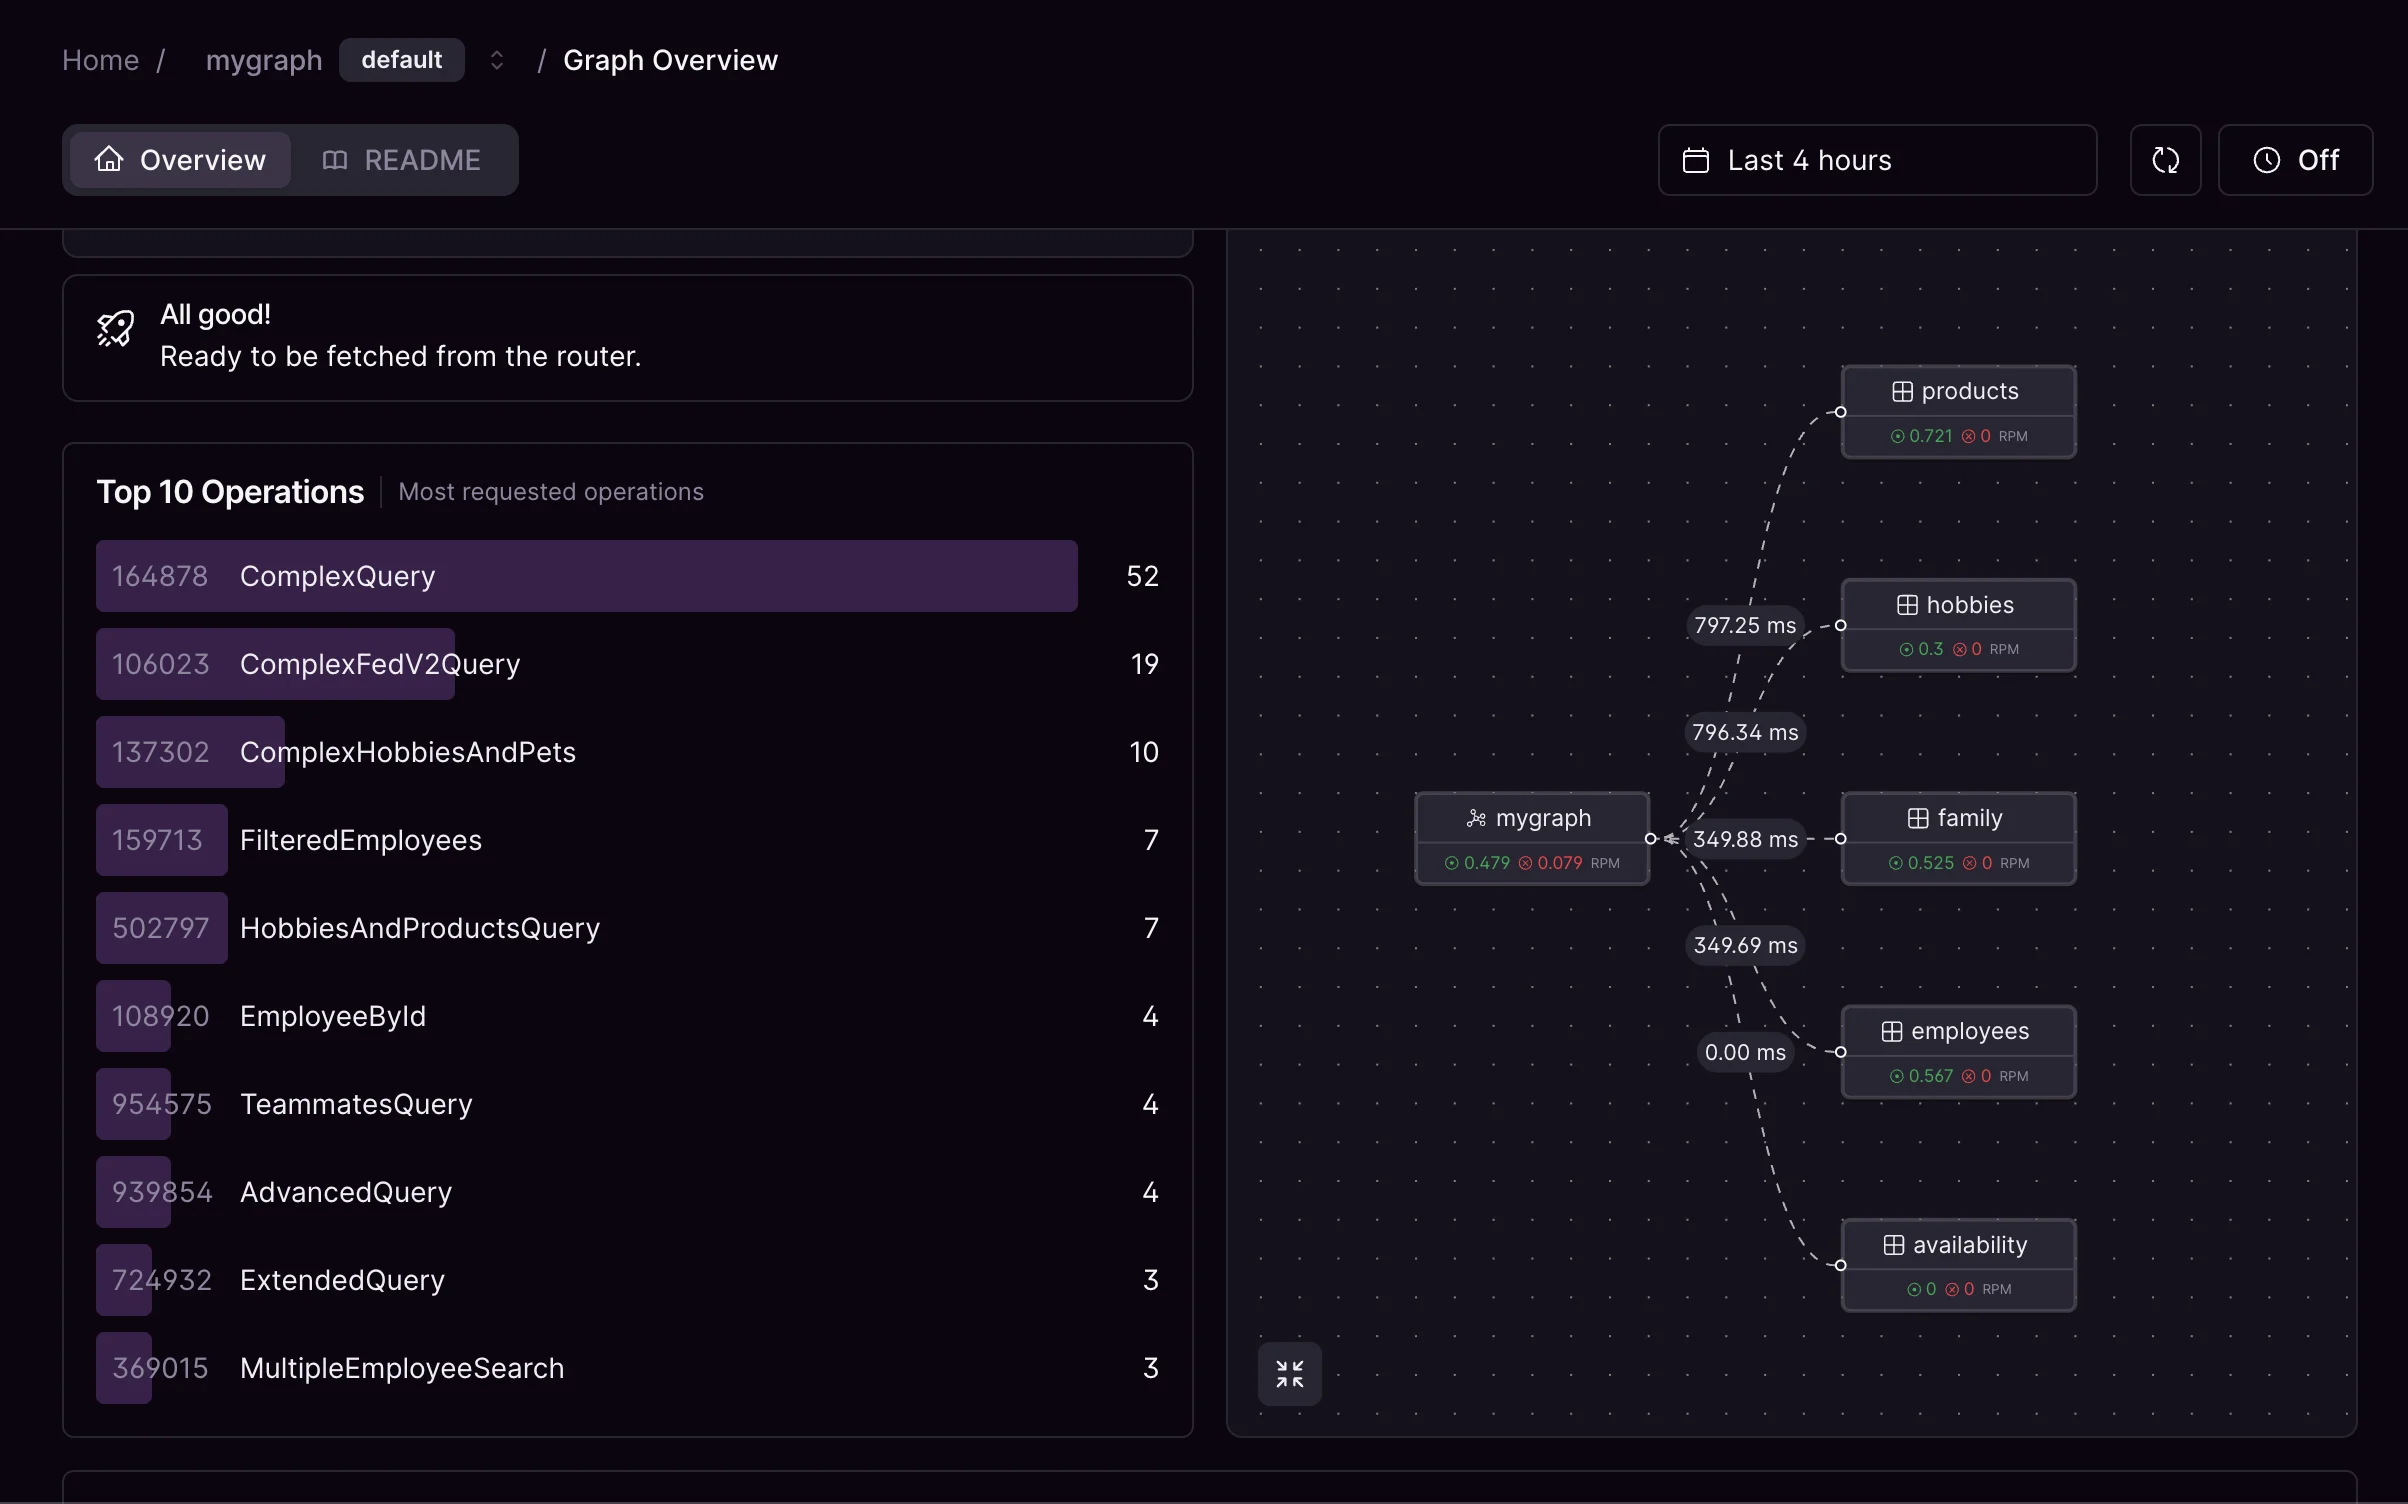
This shows the latest status of the composed schema. If there are no errors, the federated graph is ready to be fetched from the server. If not, it will display the error messages stating that the graph needs attention.
The Router URL is the endpoint through which all of your federated graph’s operations are accessed. This URL acts as the singular point of interaction for clients, routing requests to appropriate subgraphs based on the incoming operation. It’s crucial for client-side developers to know this URL for querying and mutation purposes.
This visualization displays the constellation of your federated graph. Upon closer examination, it also reveals the P95 latency and Request-Per-Minute (RPM) metrics for all services. RPM is categorized into “successful” (green) and “errored” (red) requests.
Here we present important statistics regarding your current router traffic. By default, the data displayed is from the last day, but you can adjust the date range using the datepicker located at the top right. Additionally, you can periodically fetch updates by clicking on the clock icon.
This section of the dashboard provides a day-to-day graph of total requests and errors. The total requests metric shows how often your federated graph is accessed. The errors metric shows how often requests to your graph encounter errors. These could be a result of various issues, from server-side problems to incorrect client requests. A sudden increase in errors can be an early warning sign of potential issues that need immediate attention.
This section provides information on the ten most frequently accessed operations in your federated graph over the past week. Understanding the most accessed operations can give you insights into how your users interact with your system. It may also help identify potential areas for optimization, especially if certain operations are causing high load or errors.The Overview page is your first stop in understanding the overall state of your federated graph. It is the starting point for further diagnostics, and its constant monitoring can help maintain the health of your federated graph and its associated services.