Documentation Index
Fetch the complete documentation index at: https://cosmo-docs.wundergraph.com/llms.txt
Use this file to discover all available pages before exploring further.

Help map how teams scale Federated GraphQL in the State of Federation 2026 Survey. We donate $30 to UNICEF per response → Take the survey.
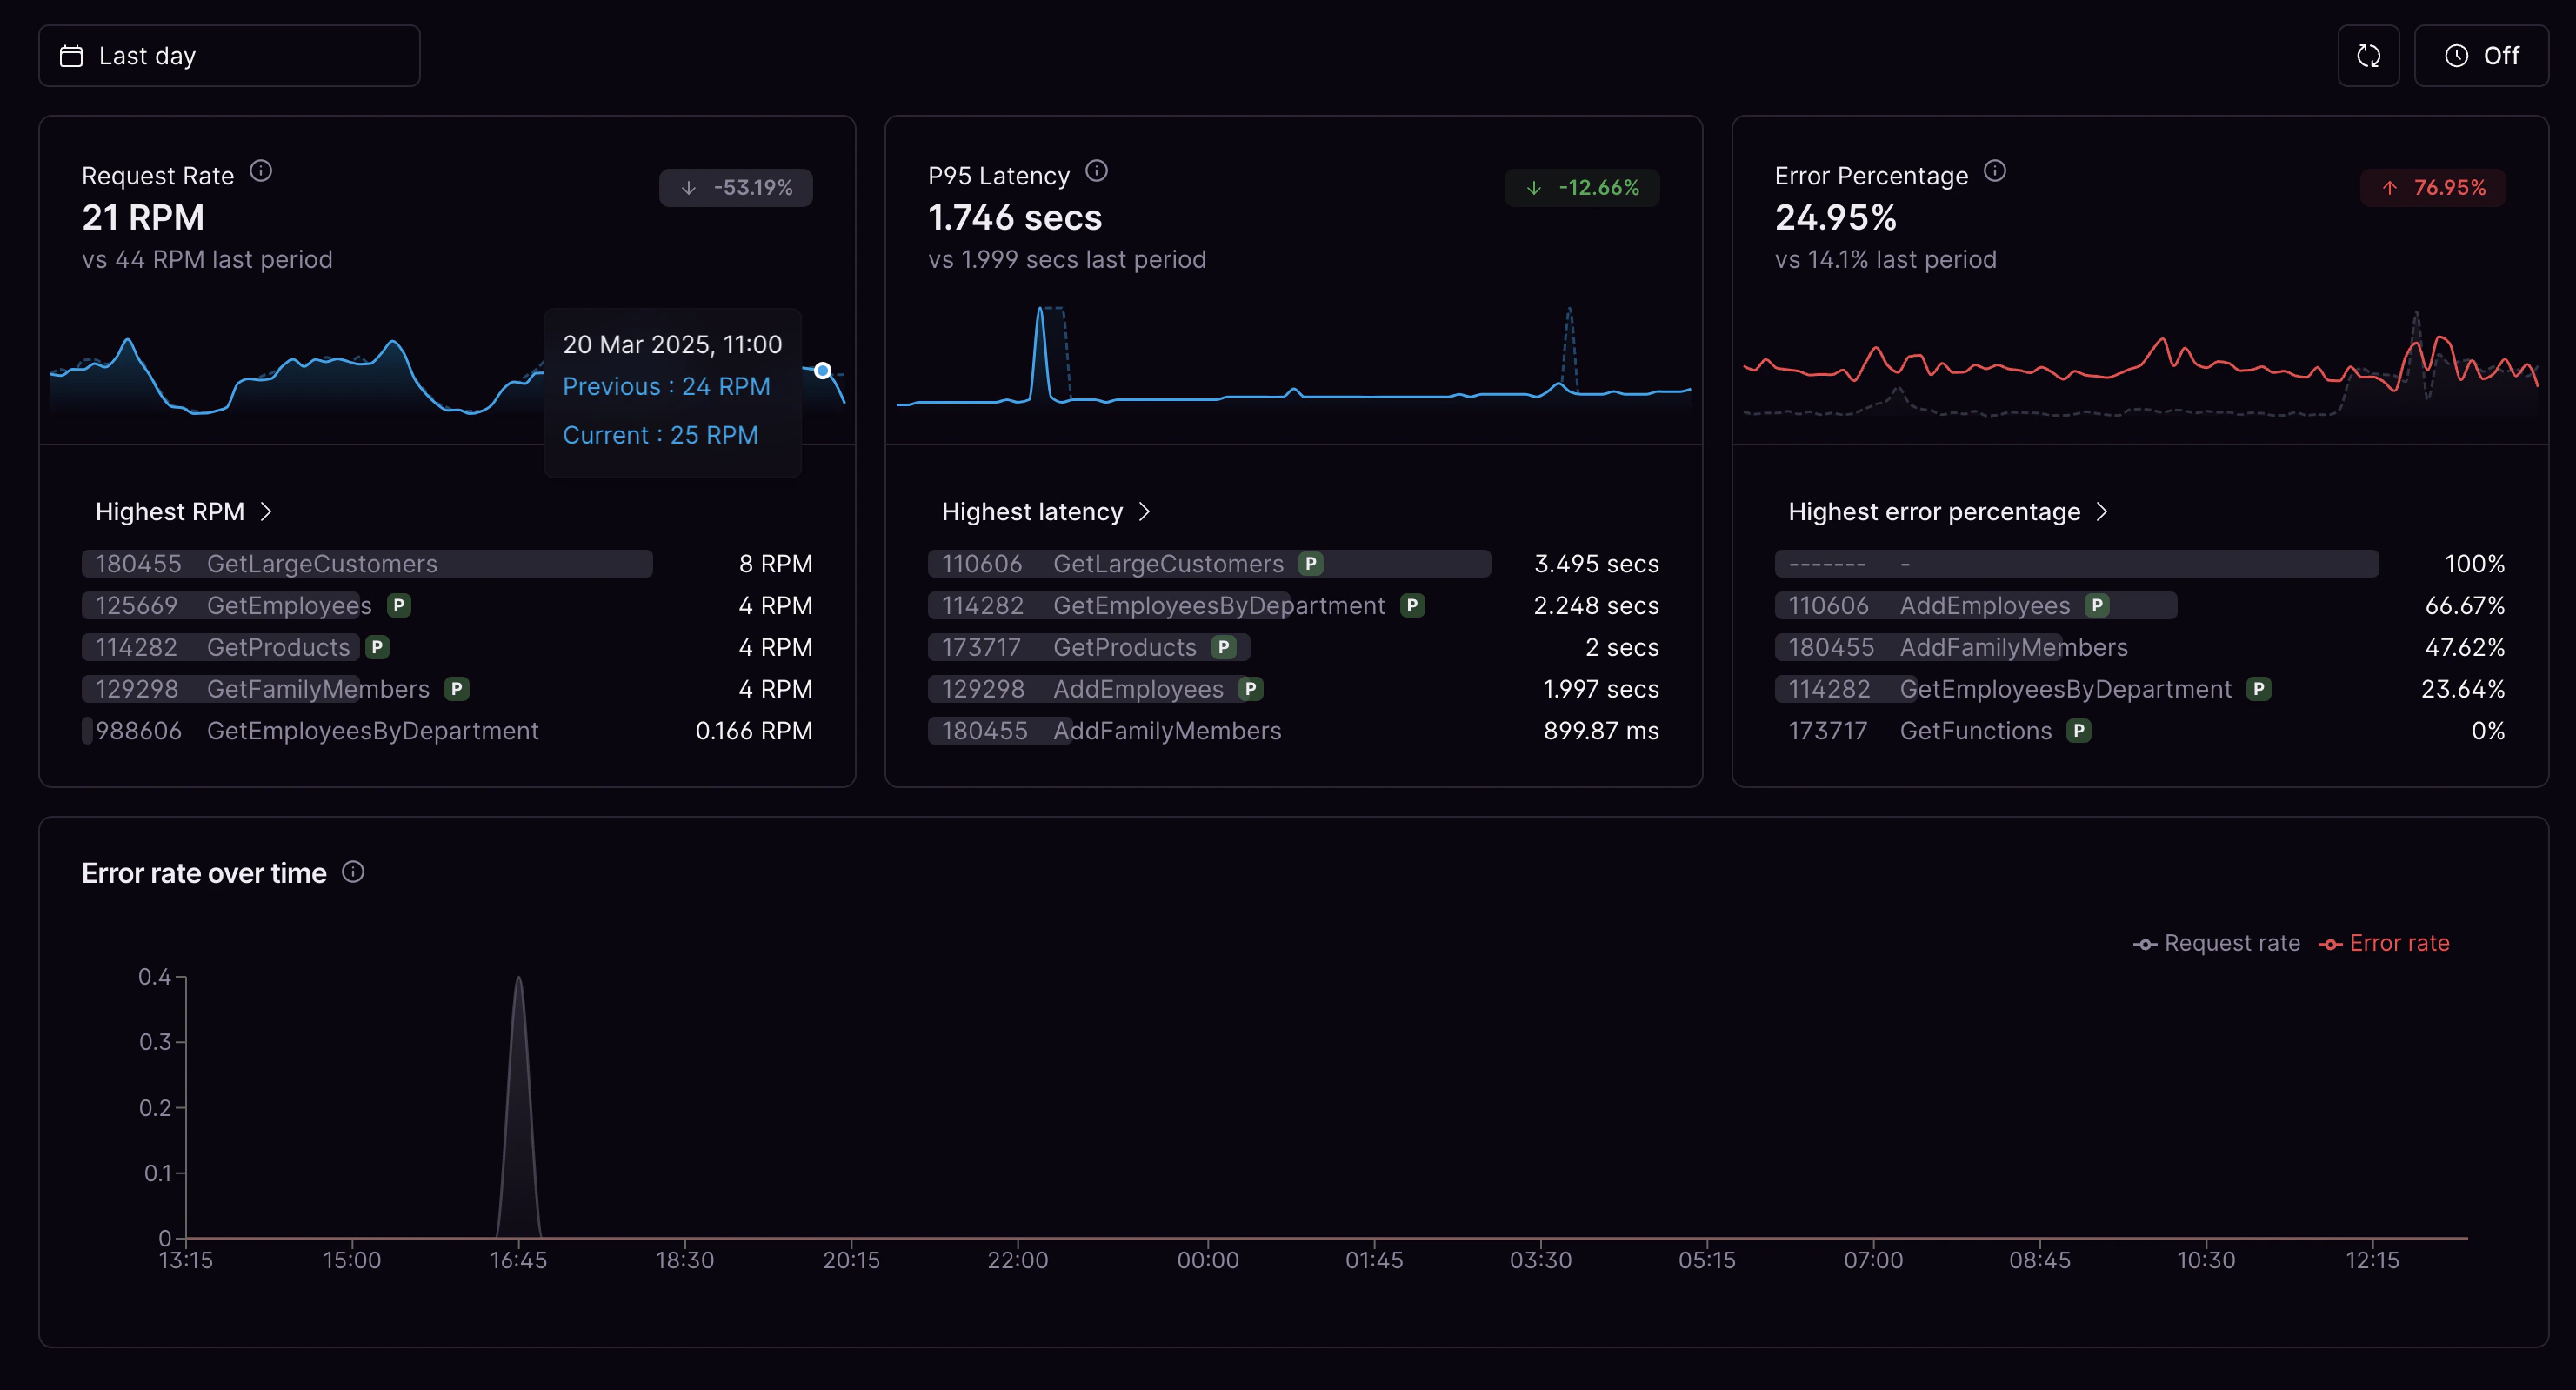
Metrics give a general overview of the performance of your federated graph. From here you can zoom in on specific time ranges and filter metrics by operation name, client name, and version.
Documentation Index
Fetch the complete documentation index at: https://cosmo-docs.wundergraph.com/llms.txt
Use this file to discover all available pages before exploring further.

Was this page helpful?