Documentation Index
Fetch the complete documentation index at: https://cosmo-docs.wundergraph.com/llms.txt
Use this file to discover all available pages before exploring further.
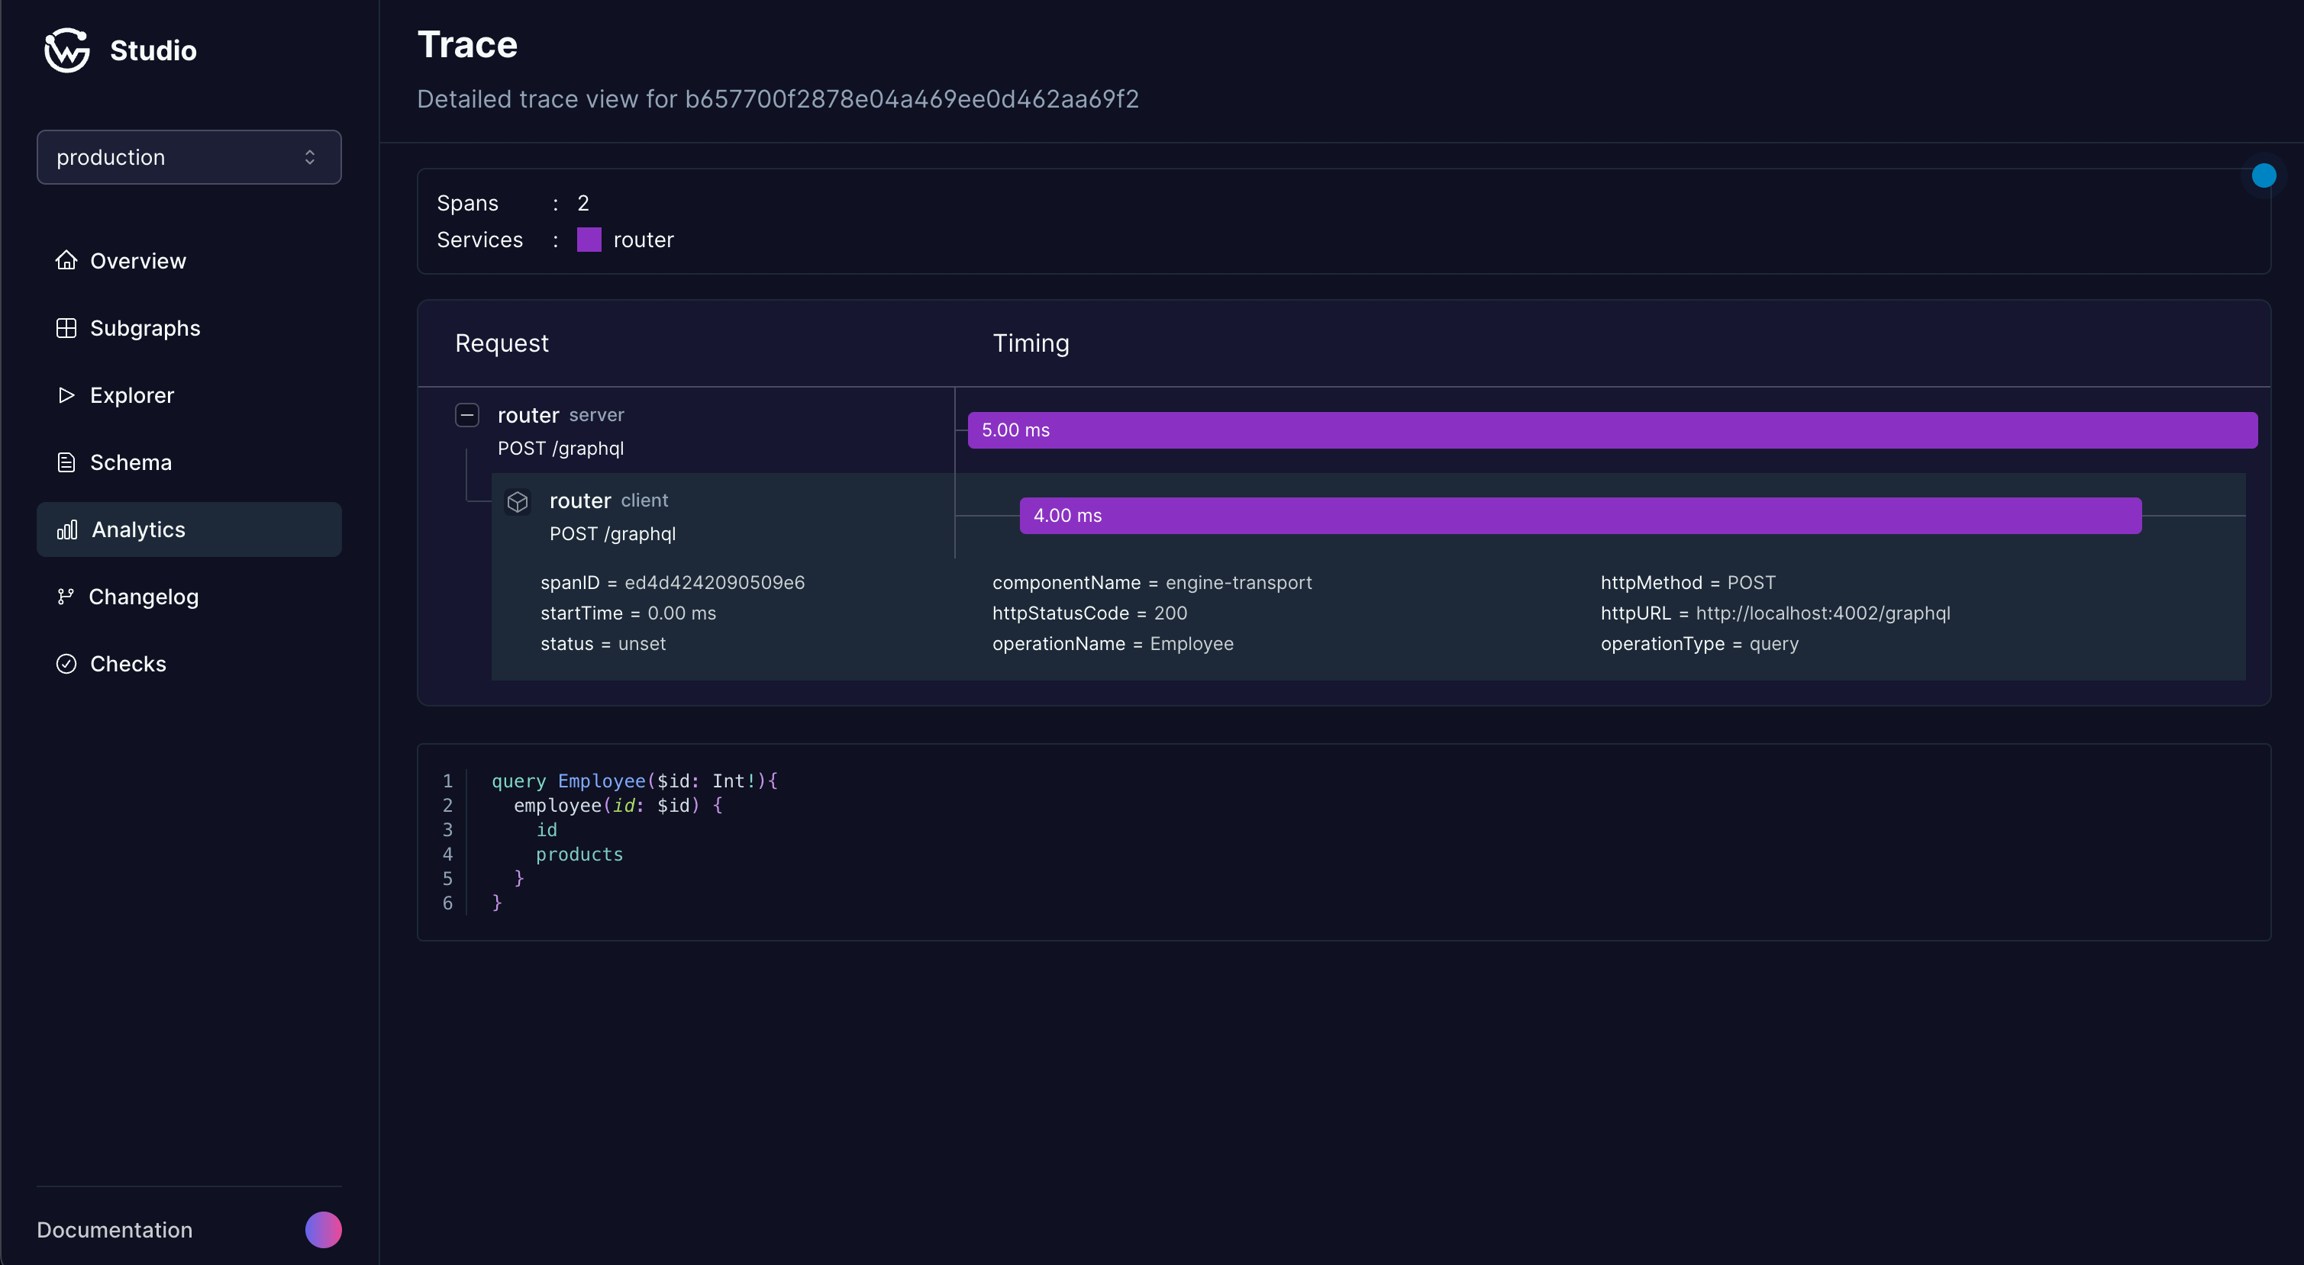
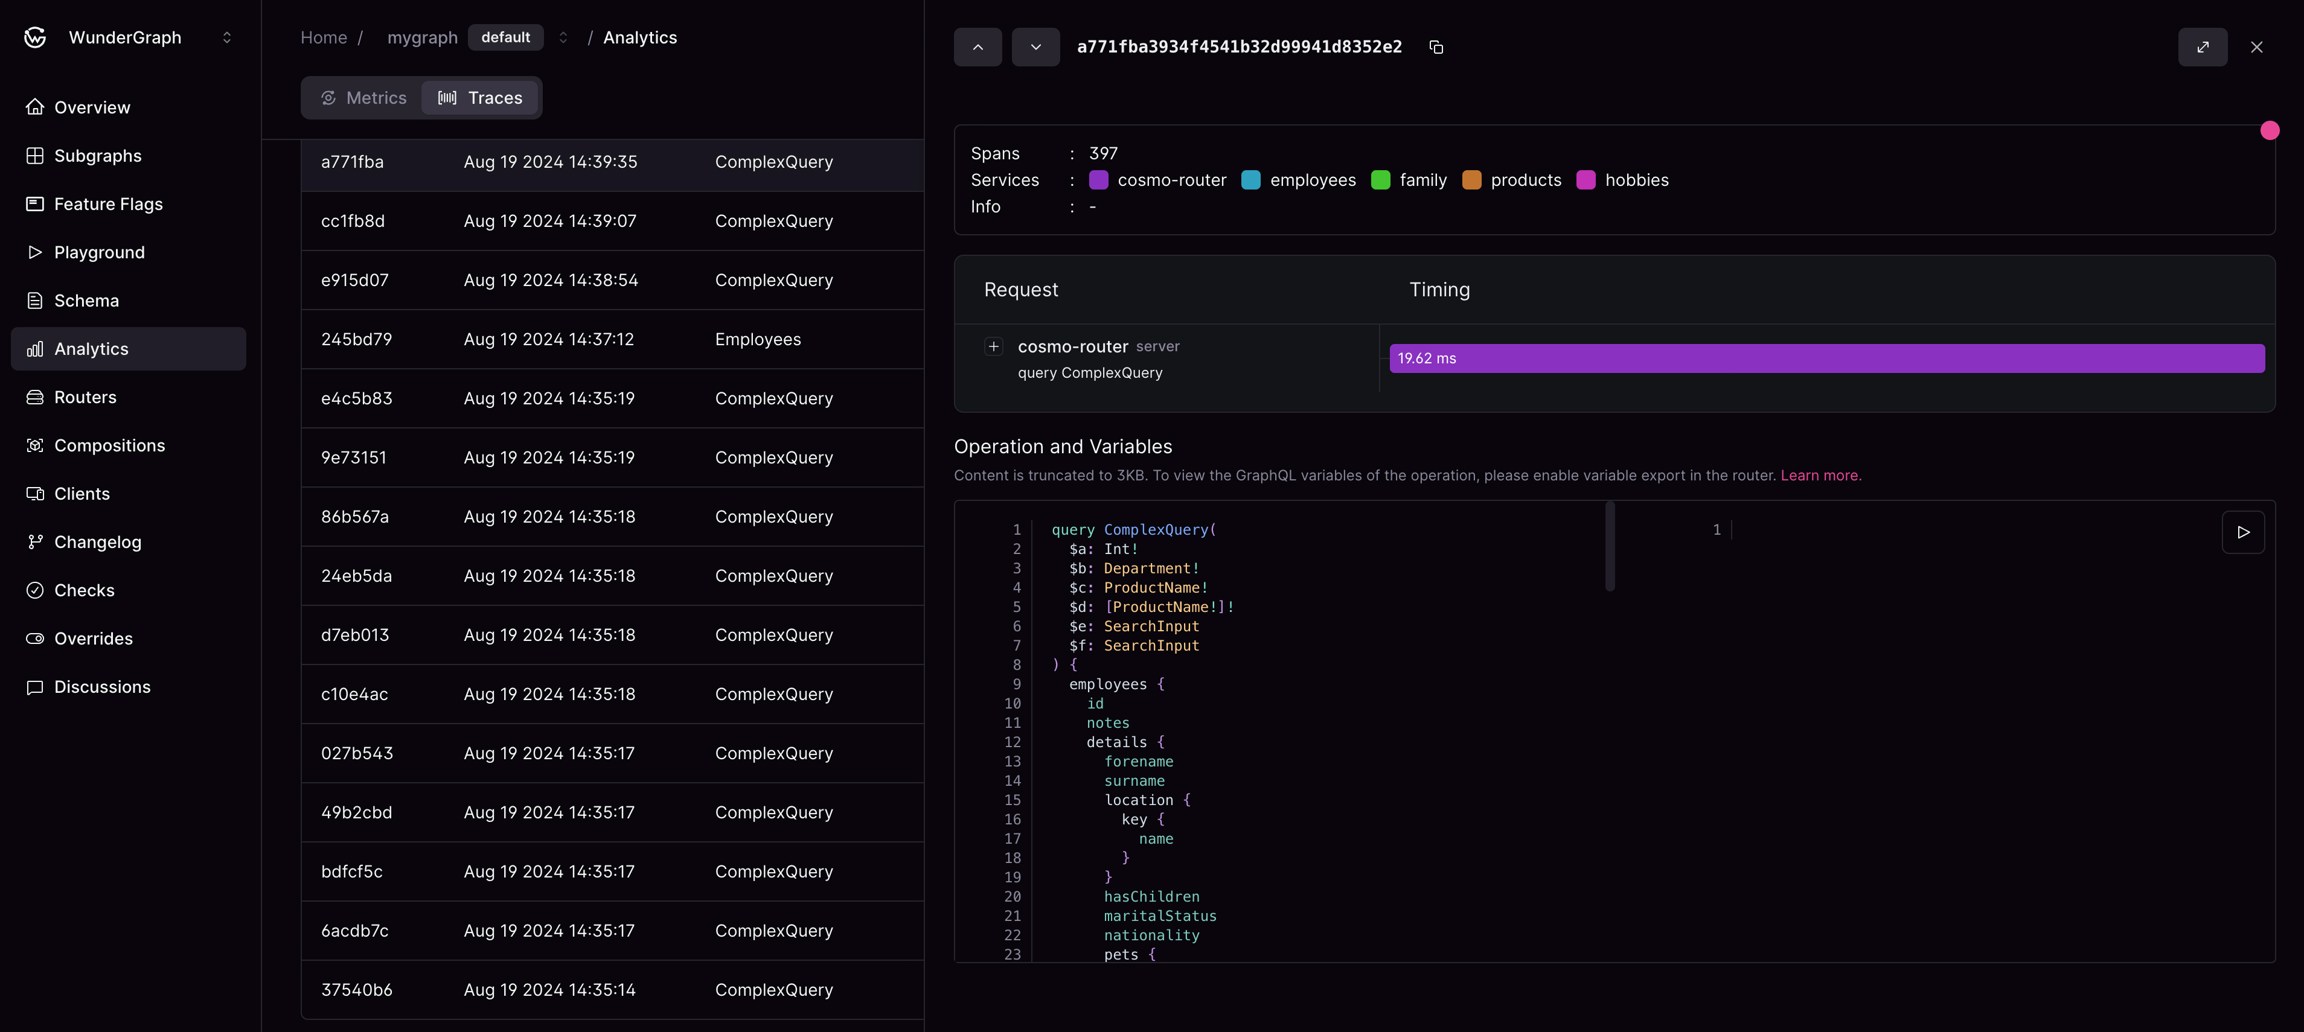
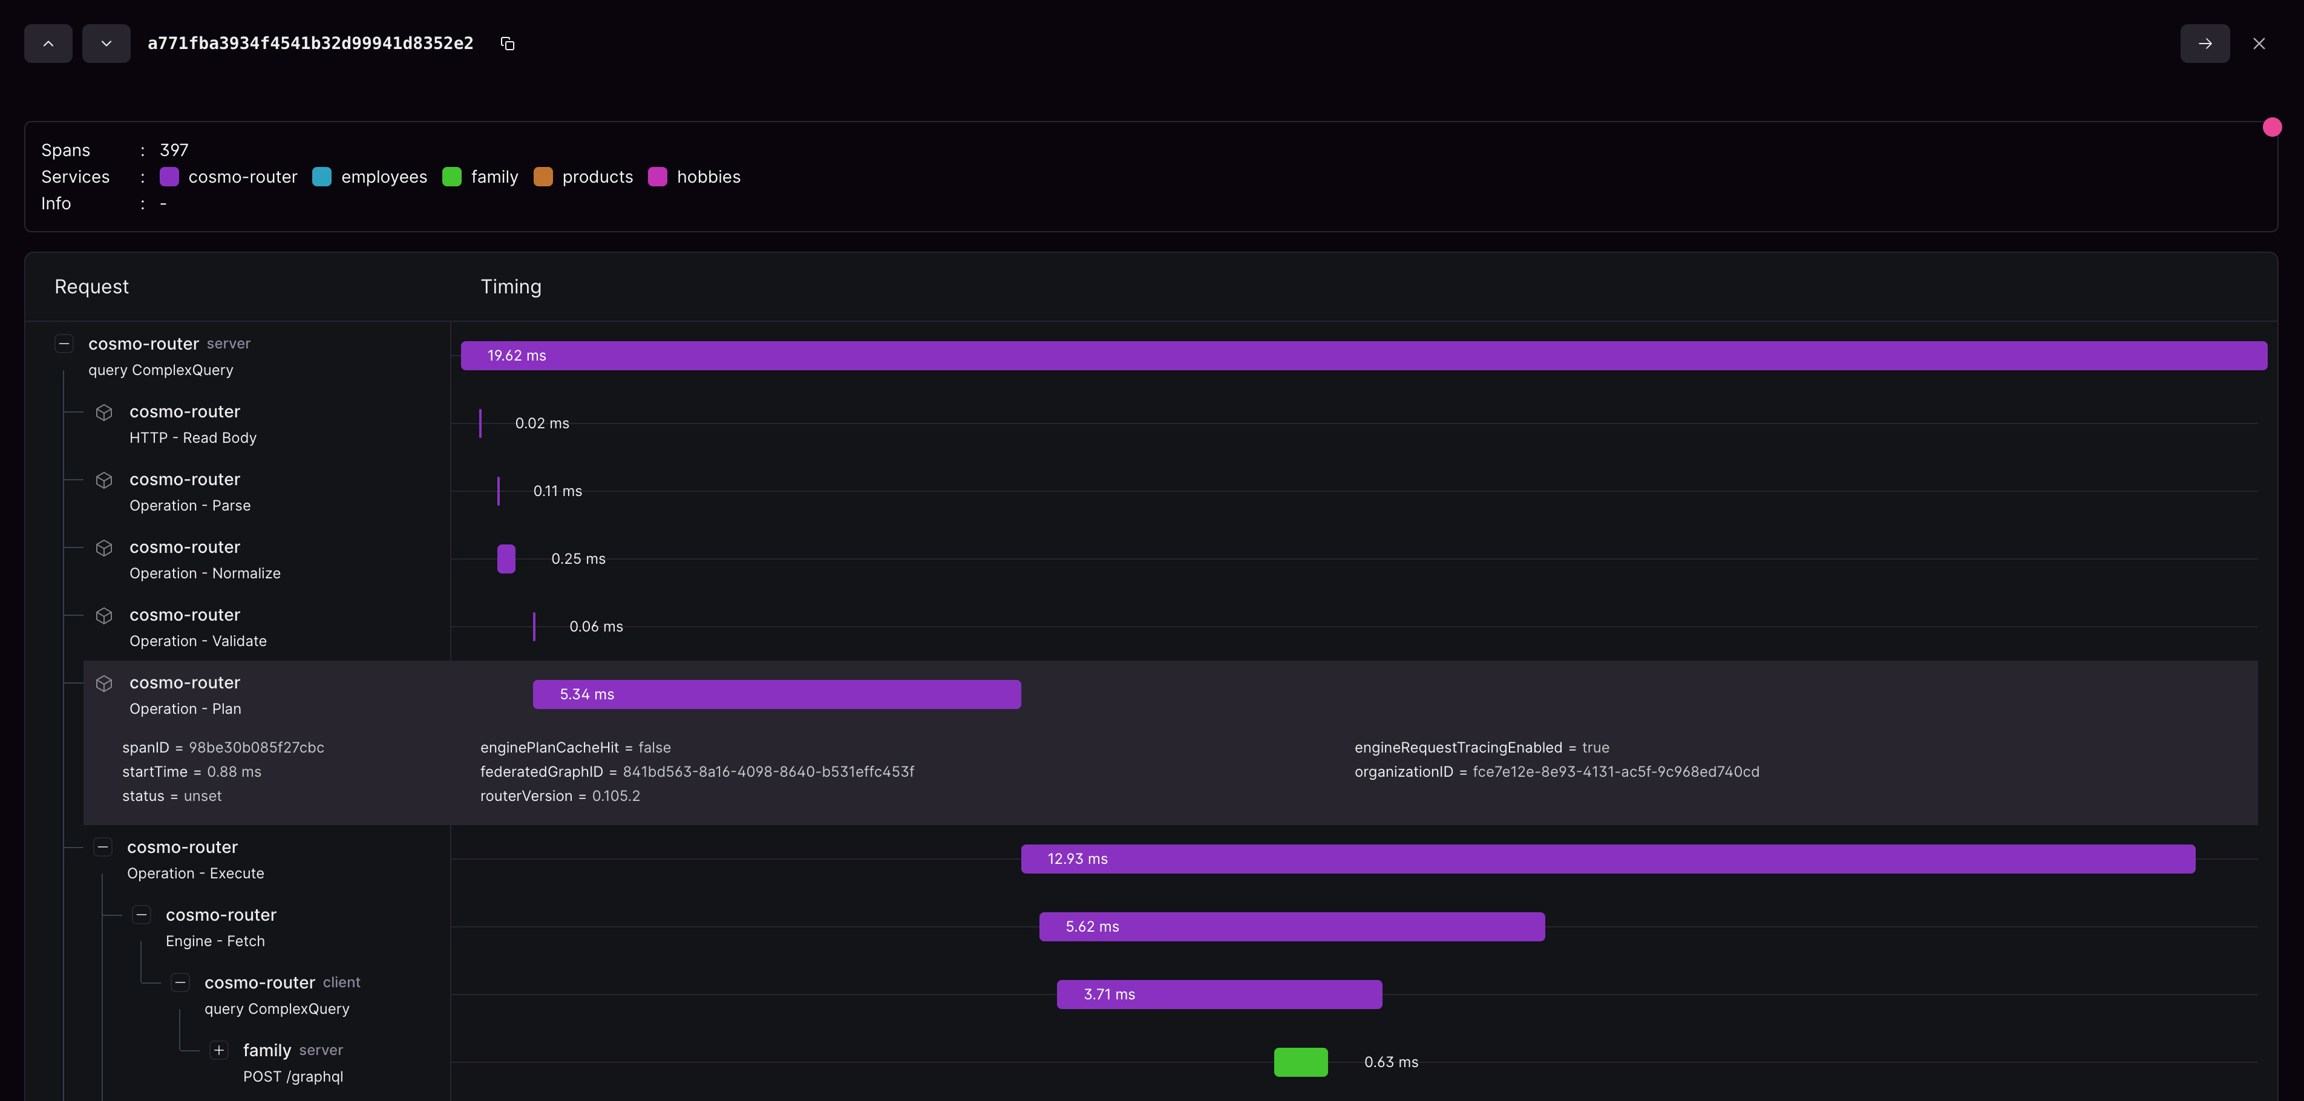
Clicking on a row under “group by none” in the analytics table will take you to the Trace Page. This page contains a distributed tracing UI, which shows the path taken by the request through your federated graph, and the operation content, which shows the specific operation performed in the request.
1. Attributes: Within the context of the Distributed Tracing Page, attributes are defined as key-value pairs that provide specific context and additional information about each trace or span. They can represent a wide range of data such as request URLs, statuses, or other data that might aid in debugging processes or analytics. By examining attributes, users gain access to granular information that enhances their understanding of each trace.
2. Services: Representing distinct systems or applications within the distributed architecture, services are integral components of the tracing page. They provide insight into the journey of a request as it travels through the services.
3. Errors: The Distributed Tracing Page also documents errors that occur during the execution of a request. These errors, alongside their detailed information such as the service they occurred in, the timestamp of occurrence, and specific error messages, are displayed within the system. This feature is invaluable for users looking to troubleshoot failed requests or unexpected behaviors in the system.
4. Auto-Refresh: The UI refreshes automatically every 10 seconds so you always look at upto date information

