Introduction
The included dashboards are particularly useful for developers, enabling you to quickly understand how Grafana can aggregate metrics and present them in a meaningful way. You can leverage these templates as a foundation, customizing them to meet your specific needs or integrating them with other data sources for a comprehensive monitoring solution.What are we going to do?
1
Checkout the repository
The cosmo repository provides us with all the necessary pre-defined configurations
2
Start Grafana and Prometheus
Makefile targets make it easy to start and stop the containers
3
Configure the Router Metrics
We need to make sure our Grafana can query for the metrics
4
Login to Grafana and explore
We’re done. Now it’s your turn to explore and build your own visualizations
Existing Dashboards
The current dashboards are located here.Prerequisites
In order to run Grafana locally you need the following tools installed:- Docker Compose: Ensure you have Docker Compose installed to manage multi-container Docker applications. This will be crucial for setting up Grafana and other services.
- Make: Install Make to automate and streamline the setup process by running defined tasks, ensuring a smooth and efficient integration.
Setup
First you need to checkout cosmo locally. Navigate to the root of the project in your terminal and run the following commandConfigure the router
To enable Grafana to visualize data effectively, you need to supply metrics to Prometheus. This involves adding specific configurations to the YAML router setup before initiating the router. Update your YAML router config with the necessary metrics endpoints or configurations to ensure seamless data flow from Prometheus to Grafana. When using OpenTelemetry (OTEL), metrics are collected via OpenTelemetry SDKs or agents, which can be configured to instrument your application code. These metrics are then exported to Prometheus using a Prometheus remote write exporter, allowing Prometheus to scrape and store the metrics data. In contrast, using the Prometheus Go client involves directly instrumenting your Go application with Prometheus client libraries. These libraries expose metrics directly through an HTTP endpoint that Prometheus can scrape at regular intervals. This method typically requires more manual setup to define and manage the metrics you wish to expose. There are two ways to configure the router for this use case:- Using OpenTelemetry (OTEL): Instrument your application with OpenTelemetry SDKs or agents. Export the collected metrics to Prometheus using a Prometheus remote write exporter. This approach allows for a more standardized integration with OpenTelemetry’s ecosystem.
- Using Prometheus Go Client: Directly instrument your Go application using Prometheus client libraries. This involves exposing metrics through an HTTP endpoint for Prometheus to scrape. This method provides more control over the metrics definition and is suitable for Go applications.
Configure Prometheus endpoint in the router
Check the prometheus config in the./dockerdirectory. By default it defines scrape configs where metrics are polled from
/metrics. This setup allows Prometheus to retrieve metrics data from specified endpoints running in Docker, leveraging the host.docker.internal domain to access containers from the host.
We need to instruct the router to expose one of these endpoint
Configure Open Telemtry to push to Prometheus
The OpenTelemetry (otel) configuration for pushing data to Prometheus looks similar to the Prometheus configuration, focusing on setting up collection intervals and specifying targets for metrics. In contrast to exposing an endpoint, configuring an exporter allows us to push data directly to a Prometheus endpoint via HTTP. This method involves setting up the appropriate exporter configuration to actively send the required telemetry data to Prometheus and visualized.Login to Grafana
You can access Grafana on http://localhost:9300 using the default credentials,admin for both the username and password.
Viewing Dashboards
Once logged in to Grafana, you will be able to see at least two essential dashboards:- Router Cache Metrics Dashboard: This dashboard offers insights into the caching operations of the router, helping you monitor cache efficiency and performance.
- Go Runtime Metrics Dashboard: Here, you can observe metrics related to the Go runtime environment, such as memory usage and goroutine counts, providing a deeper understanding of your application’s operational health.
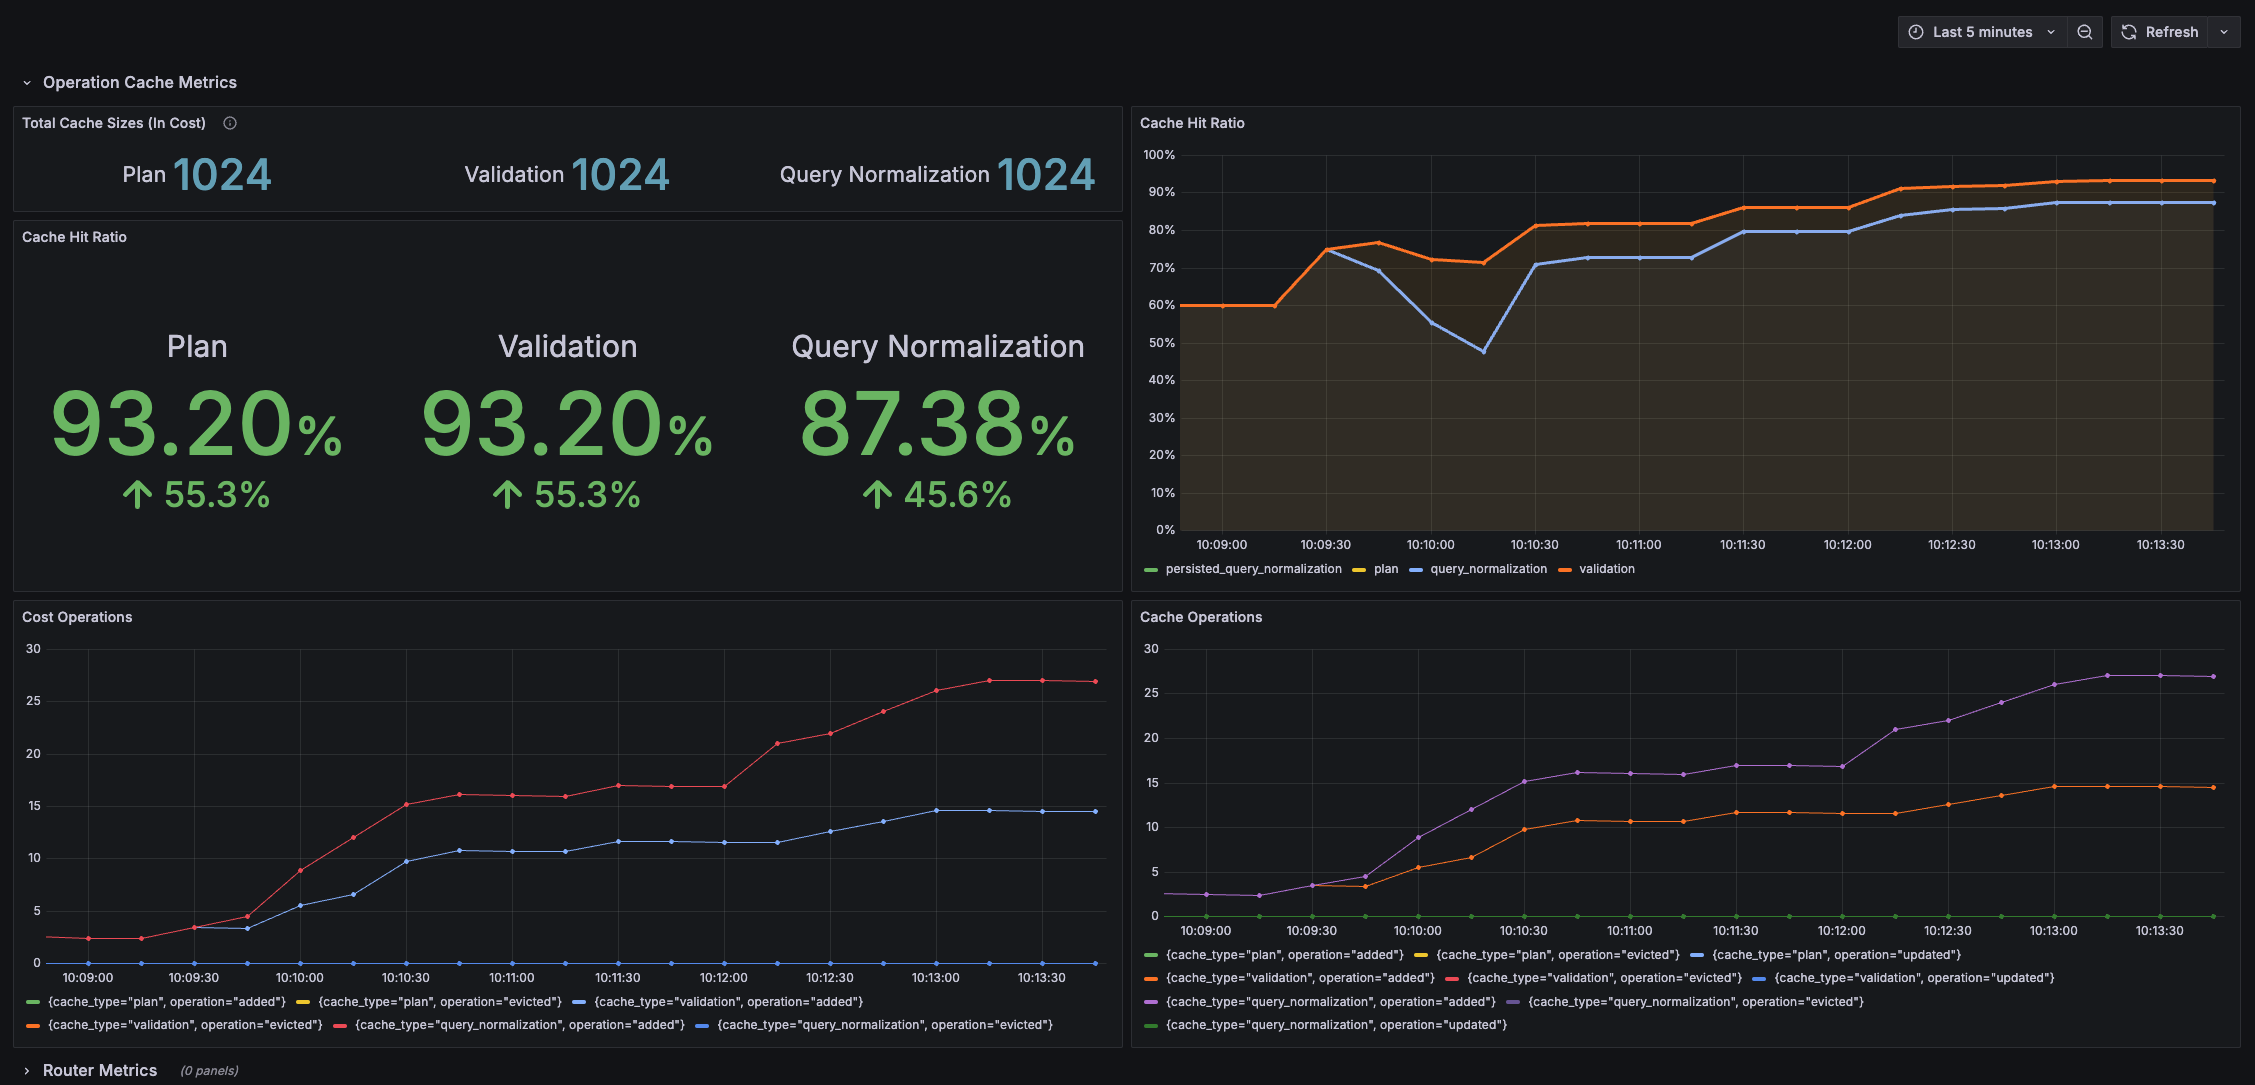
Router cache metrics
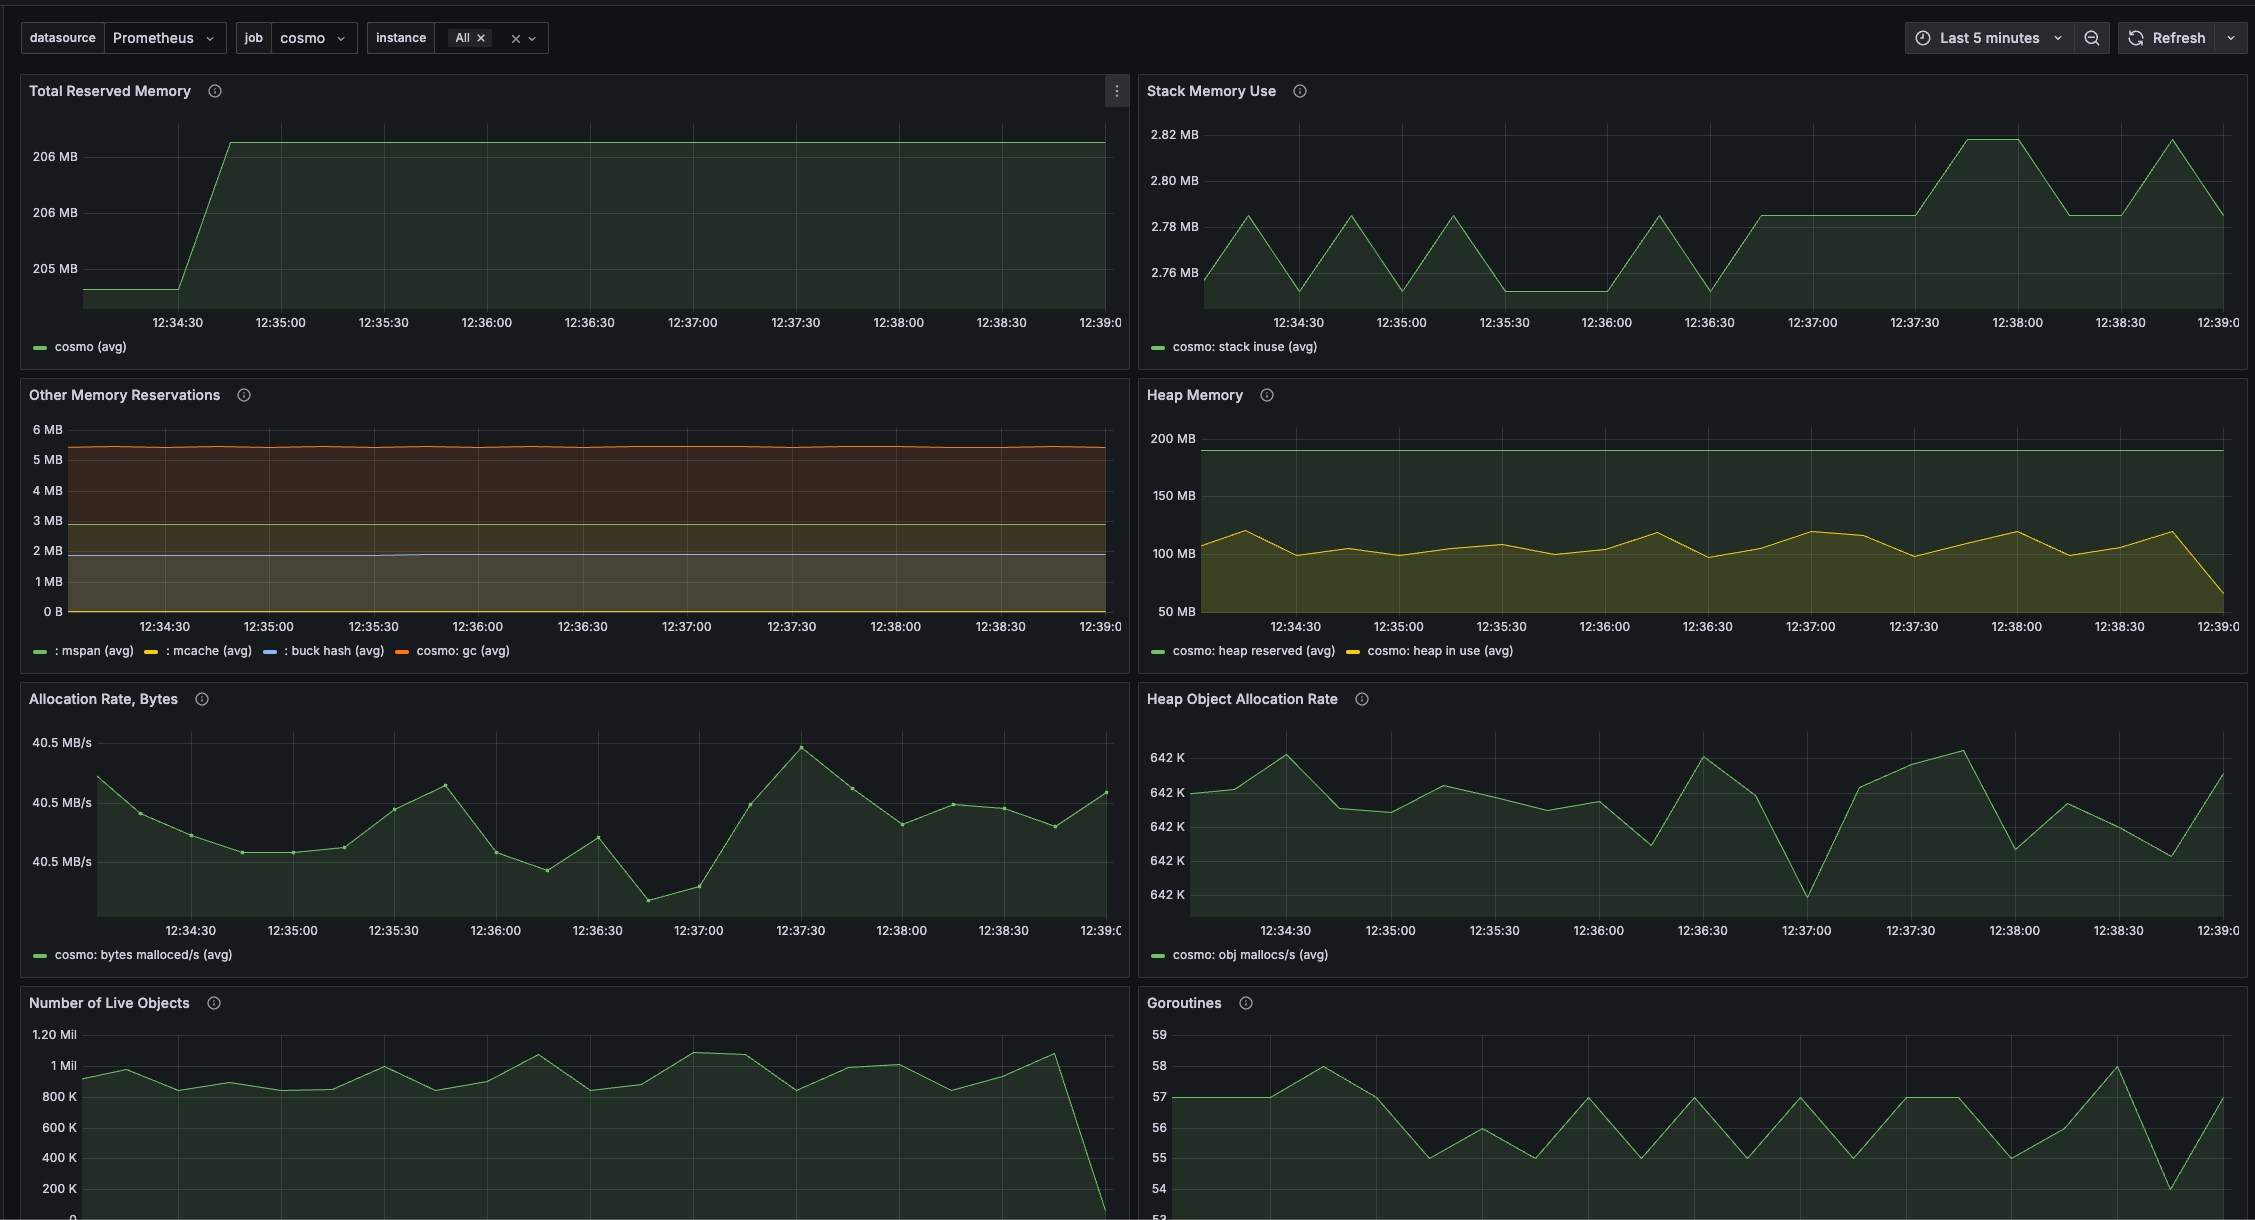
Go runtime metrics
- Examine the Existing Dashboards: Begin by reviewing the pre-built dashboards, which provide detailed insights into various aspects of your router’s performance and behaviors.
- Create Custom Dashboards: If you have specific metrics in mind or unique monitoring requirements, you can craft your own dashboards to better fit your needs and objectives.
- Explore the Diverse Metrics: Delve into the wide array of metrics available from your router to gain a comprehensive understanding of its operations, covering not just cache but many other performance indicators as well.
Removing Containers
To remove containers, you have two options:-
make infra-debug-down: This command will stop and remove the running containers without affecting the existing Docker volumes. -
make infra-debug-down-v: Use this command if you need a clean slate by removing both the containers and the existing Docker volumes. This is particularly useful when you want to start fresh, without any pre-existing metrics in Prometheus.