> ## Documentation Index
> Fetch the complete documentation index at: https://cosmo-docs.wundergraph.com/llms.txt
> Use this file to discover all available pages before exploring further.
# Advanced Request Tracing (ART)
> This section is about Advanced Request Tracing (ART) and how you can leverage it to debug execution plans and understand exactly how the Router resolves a request.
 Enabling Advanced Request Tracing may pose a potential security risk. For this reason, we have implemented a mechanism to ensure secure communication from Cosmo Studio to your routers. This allows to debug routers in production
A connection with the controlplane is **required** and a router with version **0.42.3** or **higher.**
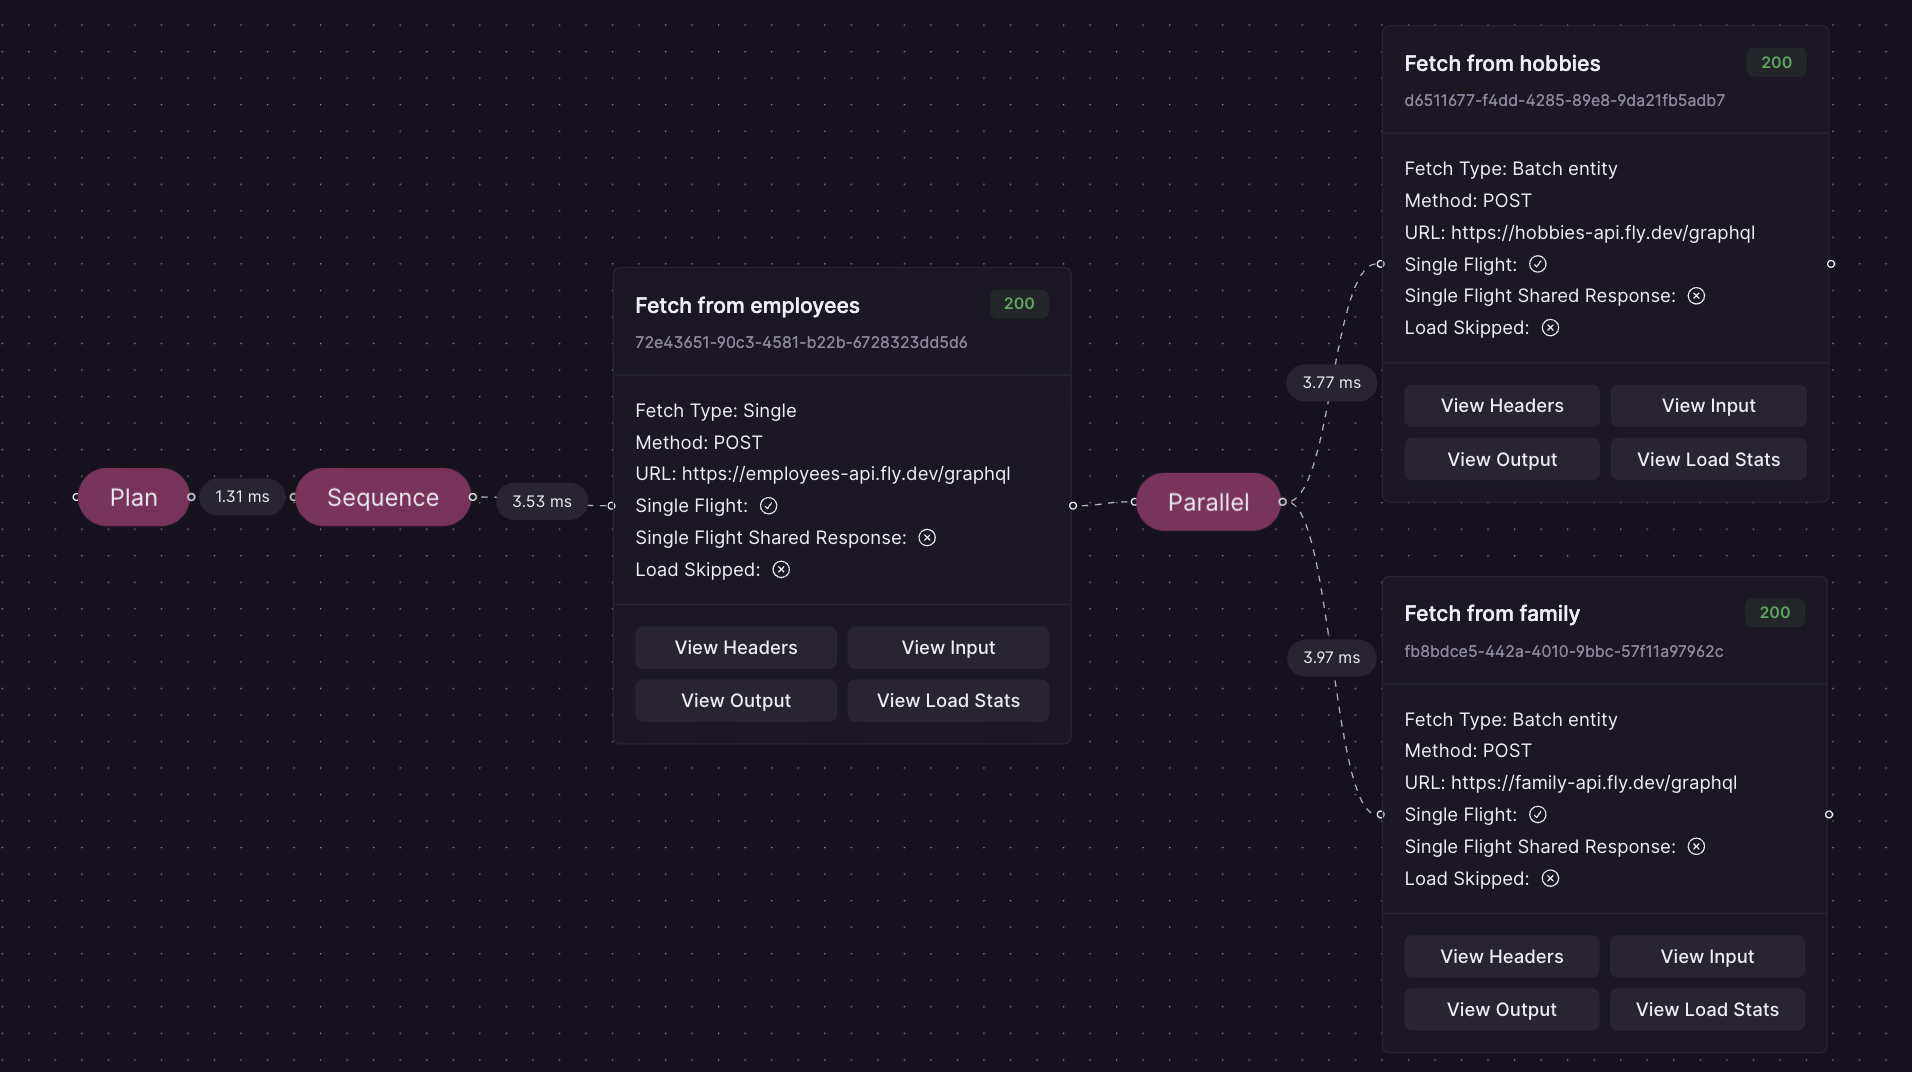
Advanced Request Tracing (ART) renders the Execution Plan including verbose information about how it was resolved as a JSON and adds it to the GraphQL response in the "extensions" part of the response using the "trace" key.
You get the following information from ART
* planning timings, e.g. how long it took to generate an execution plan
* the general structure of the execution plan
* the types of fetches (load operations) the Router does, like parallel, serial, entity, batch entity, etc.
* what actual requests are being sent to the Subgraphs
* what data was used to render the input for a load operation
* the rendered input of a load operation
* the output of a load operation
* the timings, like latency, of a load operation
All of this information can be quite useful to fully understand how the Router resolves a request and why it might be slow or behave unexpectedly.
## Configuration
For convenience, **Advanced Request Tracing is enabled by default**. When starting the Router, a warning indicates if the feature is active.
To fully disable Advanced Request Tracing, set the following environment variable:
```bash theme={"system"}
ENGINE_ENABLE_REQUEST_TRACING=false
```
### Request Parameters
To use Advanced Request Tracing, you need to either use Request Headers or Query Parameters. To disable ART, simply omit the "X-WG-Trace" Header or the "wg\_trace" Query Parameter.
#### Headers
You must set the following Header to enable tracing
```bash theme={"system"}
X-WG-Trace=true
```
#### Query Parameter
It's also possible to use Query Parameters
```bash theme={"system"}
POST http://example.com/graphql?wg_trace=true
```
#### Optional Arguments
Other (optional) arguments that are available:
* exclude\_planner\_stats (exclude planner timings in the trace)
* exclude\_raw\_input\_data (exclude the raw input data for a loader)
* exclude\_input (exclude the rendered input data for a loader)
* exclude\_output (exclude the output of a loader)
* exclude\_load\_stats (exclude load stats like latency)
* enable\_predictable\_debug\_timings (useful for debugging, makes timings constant)
### Examples
#### Enable Advanced Tracing but exclude planner stats and input via Header
```bash theme={"system"}
X-WG-Trace=exclude_planner_stats,exclude_input
```
#### Enable Advanced Tracing but exclude output via Query Parameters
```bash theme={"system"}
POST http://example.com/graphql?wg_trace=exclude_output
```
## Development
In production, ART responses are gated behind a signed request token issued by Cosmo Studio
so untrusted clients can't trigger them. For local development,
set the router environment variable `DEV_MODE` to `true` to bypass that check,
then send the header in the playground:
```bash theme={"system"}
{
"X-WG-TRACE" : "true"
}
```
## Bypassing authentication (Dangerous and Unsafe)
The router can also accept ART headers without a signed request token and without `DEV_MODE`.
This is controlled by the `force_unauthenticated_request_tracing` option
(env `ENGINE_FORCE_UNAUTHENTICATED_REQUEST_TRACING`). By default, it is disabled.
To enable it:
```yaml theme={"system"}
engine:
force_unauthenticated_request_tracing: true
```
Do not enable unauthenticated request tracing on a router that is reachable by untrusted clients.
When this flag is `true`, any client that can send a request to the router can set the header
`X-WG-Trace` (or `?wg_trace=...`) and receive the full ART payload in the response.
That payload could expose:
* internal subgraph URLs and the router's federation topology
* the exact requests sent to subgraphs, including propagated headers (which may contain auth tokens, cookies, or API keys)
* raw subgraph responses, including fields filtered by the gateway
* the complete query plan and per-fetch timings
On startup the router logs a warning whenever this flag is enabled.
Use it only for local debugging or in trusted, isolated environments.
For production debugging, keep the default and let Cosmo Studio issue signed request tokens.
Enabling Advanced Request Tracing may pose a potential security risk. For this reason, we have implemented a mechanism to ensure secure communication from Cosmo Studio to your routers. This allows to debug routers in production
A connection with the controlplane is **required** and a router with version **0.42.3** or **higher.**
Advanced Request Tracing (ART) renders the Execution Plan including verbose information about how it was resolved as a JSON and adds it to the GraphQL response in the "extensions" part of the response using the "trace" key.
You get the following information from ART
* planning timings, e.g. how long it took to generate an execution plan
* the general structure of the execution plan
* the types of fetches (load operations) the Router does, like parallel, serial, entity, batch entity, etc.
* what actual requests are being sent to the Subgraphs
* what data was used to render the input for a load operation
* the rendered input of a load operation
* the output of a load operation
* the timings, like latency, of a load operation
All of this information can be quite useful to fully understand how the Router resolves a request and why it might be slow or behave unexpectedly.
## Configuration
For convenience, **Advanced Request Tracing is enabled by default**. When starting the Router, a warning indicates if the feature is active.
To fully disable Advanced Request Tracing, set the following environment variable:
```bash theme={"system"}
ENGINE_ENABLE_REQUEST_TRACING=false
```
### Request Parameters
To use Advanced Request Tracing, you need to either use Request Headers or Query Parameters. To disable ART, simply omit the "X-WG-Trace" Header or the "wg\_trace" Query Parameter.
#### Headers
You must set the following Header to enable tracing
```bash theme={"system"}
X-WG-Trace=true
```
#### Query Parameter
It's also possible to use Query Parameters
```bash theme={"system"}
POST http://example.com/graphql?wg_trace=true
```
#### Optional Arguments
Other (optional) arguments that are available:
* exclude\_planner\_stats (exclude planner timings in the trace)
* exclude\_raw\_input\_data (exclude the raw input data for a loader)
* exclude\_input (exclude the rendered input data for a loader)
* exclude\_output (exclude the output of a loader)
* exclude\_load\_stats (exclude load stats like latency)
* enable\_predictable\_debug\_timings (useful for debugging, makes timings constant)
### Examples
#### Enable Advanced Tracing but exclude planner stats and input via Header
```bash theme={"system"}
X-WG-Trace=exclude_planner_stats,exclude_input
```
#### Enable Advanced Tracing but exclude output via Query Parameters
```bash theme={"system"}
POST http://example.com/graphql?wg_trace=exclude_output
```
## Development
In production, ART responses are gated behind a signed request token issued by Cosmo Studio
so untrusted clients can't trigger them. For local development,
set the router environment variable `DEV_MODE` to `true` to bypass that check,
then send the header in the playground:
```bash theme={"system"}
{
"X-WG-TRACE" : "true"
}
```
## Bypassing authentication (Dangerous and Unsafe)
The router can also accept ART headers without a signed request token and without `DEV_MODE`.
This is controlled by the `force_unauthenticated_request_tracing` option
(env `ENGINE_FORCE_UNAUTHENTICATED_REQUEST_TRACING`). By default, it is disabled.
To enable it:
```yaml theme={"system"}
engine:
force_unauthenticated_request_tracing: true
```
Do not enable unauthenticated request tracing on a router that is reachable by untrusted clients.
When this flag is `true`, any client that can send a request to the router can set the header
`X-WG-Trace` (or `?wg_trace=...`) and receive the full ART payload in the response.
That payload could expose:
* internal subgraph URLs and the router's federation topology
* the exact requests sent to subgraphs, including propagated headers (which may contain auth tokens, cookies, or API keys)
* raw subgraph responses, including fields filtered by the gateway
* the complete query plan and per-fetch timings
On startup the router logs a warning whenever this flag is enabled.
Use it only for local debugging or in trusted, isolated environments.
For production debugging, keep the default and let Cosmo Studio issue signed request tokens.